Honda 2008 Annual Report Download - page 77
Download and view the complete annual report
Please find page 77 of the 2008 Honda annual report below. You can navigate through the pages in the report by either clicking on the pages listed below, or by using the keyword search tool below to find specific information within the annual report.-
 1
1 -
2
-
3
-
4
-
5
-
6
-
7
-
8
-
9
-
10
-
11
-
12
-
13
-
14
-
15
-
16
-
17
-
18
-
19
-
20
-
21
-
22
-
23
-
24
-
25
-
26
-
27
-
28
-
29
-
30
-
31
-
32
-
33
-
34
-
35
-
36
-
37
-
38
-
39
-
40
-
41
-
42
-
43
-
44
-
45
-
46
-
47
-
48
-
49
-
50
-
51
-
52
-
53
-
54
-
55
-
56
-
57
-
58
-
59
-
60
-
61
-
62
-
63
-
64
-
65
-
66
-
 67
67 -
 68
68 -
 69
69 -
 70
70 -
 71
71 -
 72
72 -
 73
73 -
 74
74 -
 75
75 -
 76
76 -
 77
77 -
 78
78 -
 79
79 -
 80
80 -
 81
81 -
 82
82 -
 83
83 -
 84
84 -
 85
85 -
 86
86 -
 87
87 -
88
-
89
-
90
-
91
-
92
-
93
-
94
-
95
-
96
-
97
-
98
-
99
-
100
-
101
-
102
-
103
-
104
-
105
-
106
-
107
-
108
-
109
-
110
-
111
-
112
-
113
-
114
-
115
-
116
-
117
-
118
-
119
-
120
-
121
-
122
-
123
-
124
-
125
-
126
-
127
-
128
 |
 |

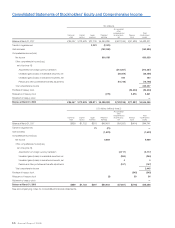
A n n u a l R e p o r t 2 0 0 8 7 5
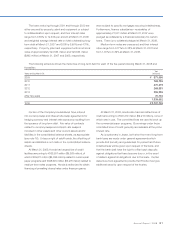
Net sales and other operating revenue and cost of sales include finance income and related cost of finance subsidiaries for
each of the years in the three-year period ended March 31, 2008 as follows:
Yen
(millions)
U.S. dollars
(millions)
(note 2)
2006 2007 2008 2008
Finance income ¥310,937 ¥413,334 ¥549,052 $5,480
Finance cost 115,636 188,844 303,890 3,033
Finance subsidiaries of the Company periodically sell
finance receivables. Finance subsidiaries sold retail finance
receivables subject to limited recourse provisions totaling
approximately ¥930,629 million, ¥562,488 million and
¥232,474 million ($2,320 million) to investors in fiscal years
2006, 2007 and 2008, respectively. Pre-tax net gains or
losses on such sales resulted in loss of ¥11,849 million, a
gain of ¥1,175 million, and a gain of ¥9 million ($0.1 million)
in fiscal years 2006, 2007 and 2008, respectively, which are
included in gain or loss on sale of receivables.
Finance subsidiaries sold direct financing lease
receivables subject to limited recourse provisions totaling
approximately ¥100,374 million in fiscal year 2006. Pre-tax
net gain on such sales resulted in a net gain of ¥483 million
is included in a gain on sale of receivables for fiscal year
2006. The leases sold during fiscal year 2006 had 100%
insurance coverage of the residual value of the vehicles
collateralizing those leases. Finance subsidiaries did not sell
any direct financing lease receivable in fiscal year 2007 and
2008.
Retained interests in securitizations were comprised of the following at March 31, 2007 and 2008:
Yen
(millions)
U.S. dollars
(millions)
(note 2)
2007 2008 2008
Subordinated certificates ¥44,198 ¥28,846 $288
Residual interests 43,912 25,790 257
Total ¥88,110 ¥54,636 $545
Key economic assumptions used in initially estimating the fair values at the date of the securitizations during each of the
years in the three-year period ended March 31, 2008 are as follows:
2006 2007 2008
Weighted average life (years) 1.60 to 1.75 1.66 to 1.77 1.66 to 1.73
Prepayment speed 1.00% to 1.30% 1.25% to 1.30% 1.25%
Expected credit losses 0.35% to 0.55% 0.23% to 0.27% 0.21% to 0.30%
Residual cash flows discount rate 6.53% to 12.00% 5.43% to 12.00% 5.82% to 12.00%
At March 31, 2008, the significant assumptions used in estimating the retained interest in the sold pools of finance
receivables are as follows:
Weighted average
assumption
Prepayment speed 1.27%
Expected credit losses 0.19%
Residual cash flows discount rate 11.44%
The sensitivity of the current fair value to immediate 10% and 20% adverse changes from expected levels for each
significant assumption above mentioned were immaterial.