GE 2015 Annual Report Download - page 91
Download and view the complete annual report
Please find page 91 of the 2015 GE annual report below. You can navigate through the pages in the report by either clicking on the pages listed below, or by using the keyword search tool below to find specific information within the annual report.-
 1
1 -
2
-
3
-
4
-
5
-
6
-
7
-
8
-
9
-
10
-
11
-
12
-
13
-
14
-
15
-
16
-
17
-
18
-
19
-
20
-
21
-
22
-
23
-
24
-
25
-
26
-
27
-
28
-
29
-
30
-
31
-
32
-
33
-
34
-
35
-
36
-
37
-
38
-
39
-
40
-
41
-
42
-
43
-
44
-
45
-
46
-
47
-
48
-
49
-
50
-
51
-
52
-
53
-
54
-
55
-
56
-
57
-
58
-
59
-
60
-
61
-
62
-
63
-
64
-
65
-
66
-
67
-
68
-
69
-
70
-
71
-
72
-
73
-
74
-
75
-
76
-
77
-
78
-
79
-
80
-
 81
81 -
 82
82 -
 83
83 -
 84
84 -
 85
85 -
 86
86 -
 87
87 -
 88
88 -
 89
89 -
 90
90 -
 91
91 -
 92
92 -
 93
93 -
 94
94 -
 95
95 -
 96
96 -
 97
97 -
 98
98 -
 99
99 -
 100
100 -
 101
101 -
102
-
103
-
104
-
105
-
106
-
107
-
108
-
109
-
110
-
111
-
112
-
113
-
114
-
115
-
116
-
117
-
118
-
119
-
120
-
121
-
122
-
123
-
124
-
125
-
126
-
127
-
128
-
129
-
130
-
131
-
132
-
133
-
134
-
135
-
136
-
137
-
138
-
139
-
140
-
141
-
142
-
143
-
144
-
145
-
146
-
147
-
148
-
149
-
150
-
151
-
152
-
153
-
154
-
155
-
156
-
157
-
158
-
159
-
160
-
161
-
162
-
163
-
164
-
165
-
166
-
167
-
168
-
169
-
170
-
171
-
172
-
173
-
174
-
175
-
176
-
177
-
178
-
179
-
180
-
181
-
182
-
183
-
184
-
185
-
186
-
187
-
188
-
189
-
190
-
191
-
192
-
193
-
194
-
195
-
196
-
197
-
198
-
199
-
200
-
201
-
202
-
203
-
204
-
205
-
206
-
207
-
208
-
209
-
210
-
211
-
212
-
213
-
214
-
215
-
216
-
217
-
218
-
219
-
220
-
221
-
222
-
223
-
224
-
225
-
226
-
227
-
228
-
229
-
230
-
231
-
232
-
233
-
234
-
235
-
236
-
237
-
238
-
239
-
240
-
241
-
242
-
243
-
244
-
245
-
246
-
247
-
248
-
249
-
250
-
251
-
252
 |
 |

MD&A SEGMENT OPERATIONS | CAPITAL
GE 2015 FORM 10-K 63
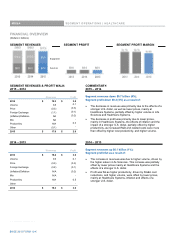
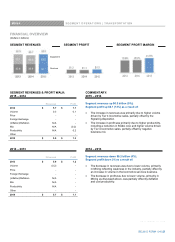
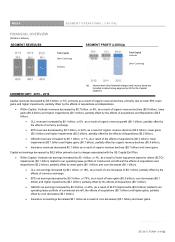
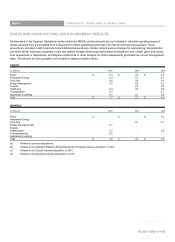
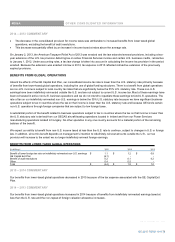
FINANCIAL OVERVIEW
(Dollars in billions)
SEGMENT REVENUES SEGMENT PROFIT (LOSS)(a)
(a) Interest and other financial charges and income taxes are
included in determining segment profit for the Capital
segment.
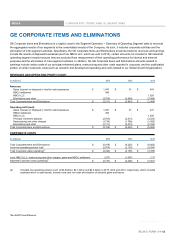
COMMENTARY: 2015 ± 2014
Capital revenues decreased by $0.5 billion, or 5%, primarily as a result of organic revenue declines, primarily due to lower ENI, lower
gains and higher impairments, partially offset by the effects of acquisitions and dispositions.
x Within Capital, Verticals revenues decreased by $0.7 billion, or 6%, as a result of organic revenue declines ($0.9 billion), lower
gains ($0.2 billion) and higher impairments ($0.1 billion), partially offset by the effects of acquisitions and dispositions ($0.5
billion).
x CLL revenues increased by $0.1 billion, or 6%, as a result of organic revenue growth ($0.1 billion), partially offset by
the effects of currency exchange.
x EFS revenues decreased by $0.7 billion, or 42%, as a result of organic revenue declines ($0.5 billion), lower gains
($0.3 billion) and higher impairments ($0.2 billion), partially offset by the effects of dispositions ($0.2 billion).
x GECAS revenues increased by $0.1 billion, or 1%, as a result of the effects of acquisitions ($0.3 billion), lower
impairments ($0.1 billion) and higher gains ($0.1 billion), partially offset by organic revenue declines ($0.4 billion).
x Insurance revenues decreased $0.1 billion as a result of organic revenue declines ($0.1 billion) and lower gains.
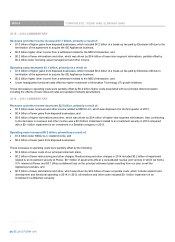
Capital net earnings decreased by $9.2 billion primarily due to charges associated with the GE Capital Exit Plan.
x Within Capital, Verticals net earnings increased by $0.1 billion, or 4%, as a result of lower equipment leased to others (ELTO)
impairments ($0.1 billion) related to our operating lease portfolio of commercial aircraft and the effects of acquisitions and
dispositions ($0.2 billion), partially offset by lower gains ($0.1 billion) and core decreases ($0.1 billion).
x CLL net earnings increased by $0.1 billion, or 18%, as a result of core increases of $0.1 billion, partially offset by the
effects of currency exchange.
x EFS net earnings decreased by $0.3 billion, or 78%, as a result of lower gains ($0.2 billion), core decreases ($0.1
billion) and higher impairments ($0.1 billion), partially offset by the effects of dispositions ($0.1 billion).
x GECAS net earnings increased by $0.3 billion, or 28%, as a result of ELTO impairments ($0.2 billion) related to our
operating lease portfolio of commercial aircraft, the effects of acquisitions ($0.1 billion) and higher gains, partially
offset by core decreases ($0.1 billion).
x Insurance net earnings decreased $0.1 billion as a result of core decreases ($0.1 billion) and lower gains.
Total Capital
Other Continuing
Verticals
Total Capital
Verticals
Other Continuing
GE 2015 FORM 10-K 63