GE 2015 Annual Report Download - page 33
Download and view the complete annual report
Please find page 33 of the 2015 GE annual report below. You can navigate through the pages in the report by either clicking on the pages listed below, or by using the keyword search tool below to find specific information within the annual report.-
 1
1 -
2
-
3
-
4
-
5
-
6
-
7
-
8
-
9
-
10
-
11
-
12
-
13
-
14
-
15
-
16
-
17
-
18
-
19
-
20
-
21
-
22
-
 23
23 -
 24
24 -
 25
25 -
 26
26 -
 27
27 -
 28
28 -
 29
29 -
 30
30 -
 31
31 -
 32
32 -
 33
33 -
 34
34 -
 35
35 -
 36
36 -
 37
37 -
 38
38 -
 39
39 -
 40
40 -
 41
41 -
 42
42 -
 43
43 -
44
-
45
-
46
-
47
-
48
-
49
-
50
-
51
-
52
-
53
-
54
-
55
-
56
-
57
-
58
-
59
-
60
-
61
-
62
-
63
-
64
-
65
-
66
-
67
-
68
-
69
-
70
-
71
-
72
-
73
-
74
-
75
-
76
-
77
-
78
-
79
-
80
-
81
-
82
-
83
-
84
-
85
-
86
-
87
-
88
-
89
-
90
-
91
-
92
-
93
-
94
-
95
-
96
-
97
-
98
-
99
-
100
-
101
-
102
-
103
-
104
-
105
-
106
-
107
-
108
-
109
-
110
-
111
-
112
-
113
-
114
-
115
-
116
-
117
-
118
-
119
-
120
-
121
-
122
-
123
-
124
-
125
-
126
-
127
-
128
-
129
-
130
-
131
-
132
-
133
-
134
-
135
-
136
-
137
-
138
-
139
-
140
-
141
-
142
-
143
-
144
-
145
-
146
-
147
-
148
-
149
-
150
-
151
-
152
-
153
-
154
-
155
-
156
-
157
-
158
-
159
-
160
-
161
-
162
-
163
-
164
-
165
-
166
-
167
-
168
-
169
-
170
-
171
-
172
-
173
-
174
-
175
-
176
-
177
-
178
-
179
-
180
-
181
-
182
-
183
-
184
-
185
-
186
-
187
-
188
-
189
-
190
-
191
-
192
-
193
-
194
-
195
-
196
-
197
-
198
-
199
-
200
-
201
-
202
-
203
-
204
-
205
-
206
-
207
-
208
-
209
-
210
-
211
-
212
-
213
-
214
-
215
-
216
-
217
-
218
-
219
-
220
-
221
-
222
-
223
-
224
-
225
-
226
-
227
-
228
-
229
-
230
-
231
-
232
-
233
-
234
-
235
-
236
-
237
-
238
-
239
-
240
-
241
-
242
-
243
-
244
-
245
-
246
-
247
-
248
-
249
-
250
-
251
-
252
 |
 |
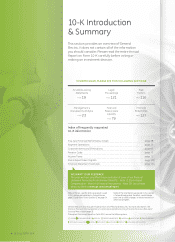
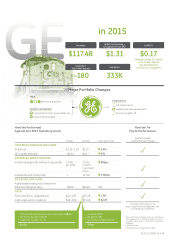
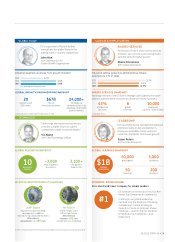
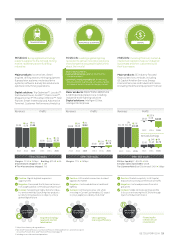
Target Actual Year-over-year
OPERATING EARNINGS PER SHARE1
Industrial $1.10–1.20 $1.14 19%
GE Capital Verticals ~$0.15 $0.17 6%
OPERATING PROFIT MARGINS1, 2
Industrial segments (without Corporate) 17.0% 17.0% 80bps
by 2016 in 2015
(1 year ahead
of plan)
Industrial (with Corporate) + 15.3%3 110bps
GE CAPITAL EXIT PLAN
Asset sales (ending net investment
(ENI) excluding liquidity) ~$90B $104B N/A
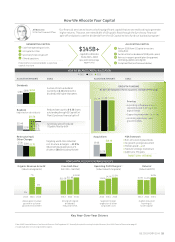
CASH
Free cash flow + dispositions1 $12–15B $15.2B
23%
Cash returned to investors $10–30B $33.0B $22B
1. Non-GAAP Financial Measure. See Financial Measures
That Supplement U.S. Generally Accepted Accounting
Principles Measures (Non-GAAP Financial Measures)
on page 95.
2. Excluding Alstom.
3. Excluding restructuring and other & gains.
How We Performed
Against Our 2015 Operating Goals
How We Tie
Pay to Performance
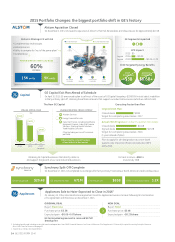
Major Portfolio Changes
Dispositions
GE Capital exits
Appliances sale agreed upon
Synchrony split-off
M&A
Alstom acquisition
Organic Investment
Launched Current, powered by GE
Launched GE Digital
Goals Included
in 2015 Bonus Program
R
R
R
R
For more information on our
pay vs. performance alignment, see
our 2016 proxy statement.
GE Cash From Operating Activities (CFOA) ($16.4B) 8%
– Net Plant & Equipment ($2.8B)
+ Disposition Proceeds ($1.7B)
= $15.2B
Dividends ($9.3B)
+ Buyback ($3.3B)
+ Synchrony Exchange ($20.4B)
= $33.0B
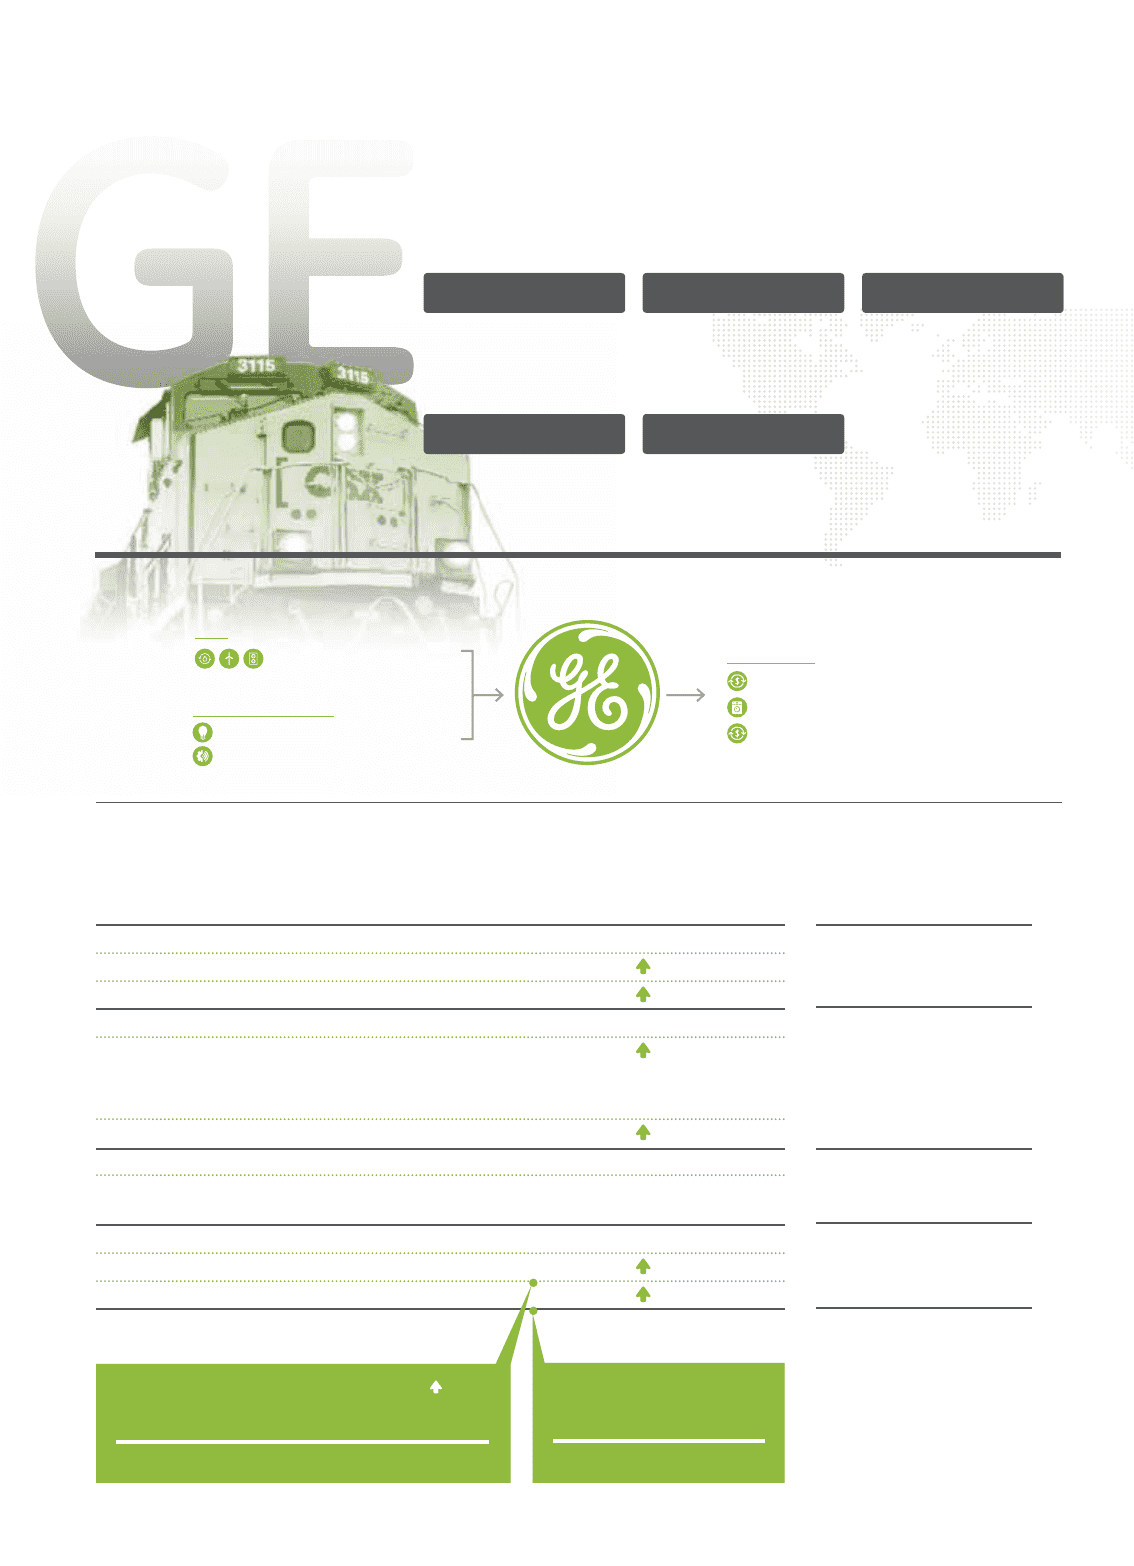
Revenues
$117.4B
GAAP EPS
Industrial Operating +
GE Capital Verticals EPS1
$0.17
Reflects certain GE Capital
exit-related charges
(see Supplemental
Information on page 95)
$1.31
Employees
333K
Countries in
Which We Compete
~180
in 2015
GE 2015 FORM 10-K 5