GE 2015 Annual Report Download - page 76
Download and view the complete annual report
Please find page 76 of the 2015 GE annual report below. You can navigate through the pages in the report by either clicking on the pages listed below, or by using the keyword search tool below to find specific information within the annual report.-
 1
1 -
2
-
3
-
4
-
5
-
6
-
7
-
8
-
9
-
10
-
11
-
12
-
13
-
14
-
15
-
16
-
17
-
18
-
19
-
20
-
21
-
22
-
23
-
24
-
25
-
26
-
27
-
28
-
29
-
30
-
31
-
32
-
33
-
34
-
35
-
36
-
37
-
38
-
39
-
40
-
41
-
42
-
43
-
44
-
45
-
46
-
47
-
48
-
49
-
50
-
51
-
52
-
53
-
54
-
55
-
56
-
57
-
58
-
59
-
60
-
61
-
62
-
63
-
64
-
65
-
 66
66 -
 67
67 -
 68
68 -
 69
69 -
 70
70 -
 71
71 -
 72
72 -
 73
73 -
 74
74 -
 75
75 -
 76
76 -
 77
77 -
 78
78 -
 79
79 -
 80
80 -
 81
81 -
 82
82 -
 83
83 -
 84
84 -
 85
85 -
 86
86 -
87
-
88
-
89
-
90
-
91
-
92
-
93
-
94
-
95
-
96
-
97
-
98
-
99
-
100
-
101
-
102
-
103
-
104
-
105
-
106
-
107
-
108
-
109
-
110
-
111
-
112
-
113
-
114
-
115
-
116
-
117
-
118
-
119
-
120
-
121
-
122
-
123
-
124
-
125
-
126
-
127
-
128
-
129
-
130
-
131
-
132
-
133
-
134
-
135
-
136
-
137
-
138
-
139
-
140
-
141
-
142
-
143
-
144
-
145
-
146
-
147
-
148
-
149
-
150
-
151
-
152
-
153
-
154
-
155
-
156
-
157
-
158
-
159
-
160
-
161
-
162
-
163
-
164
-
165
-
166
-
167
-
168
-
169
-
170
-
171
-
172
-
173
-
174
-
175
-
176
-
177
-
178
-
179
-
180
-
181
-
182
-
183
-
184
-
185
-
186
-
187
-
188
-
189
-
190
-
191
-
192
-
193
-
194
-
195
-
196
-
197
-
198
-
199
-
200
-
201
-
202
-
203
-
204
-
205
-
206
-
207
-
208
-
209
-
210
-
211
-
212
-
213
-
214
-
215
-
216
-
217
-
218
-
219
-
220
-
221
-
222
-
223
-
224
-
225
-
226
-
227
-
228
-
229
-
230
-
231
-
232
-
233
-
234
-
235
-
236
-
237
-
238
-
239
-
240
-
241
-
242
-
243
-
244
-
245
-
246
-
247
-
248
-
249
-
250
-
251
-
252
 |
 |
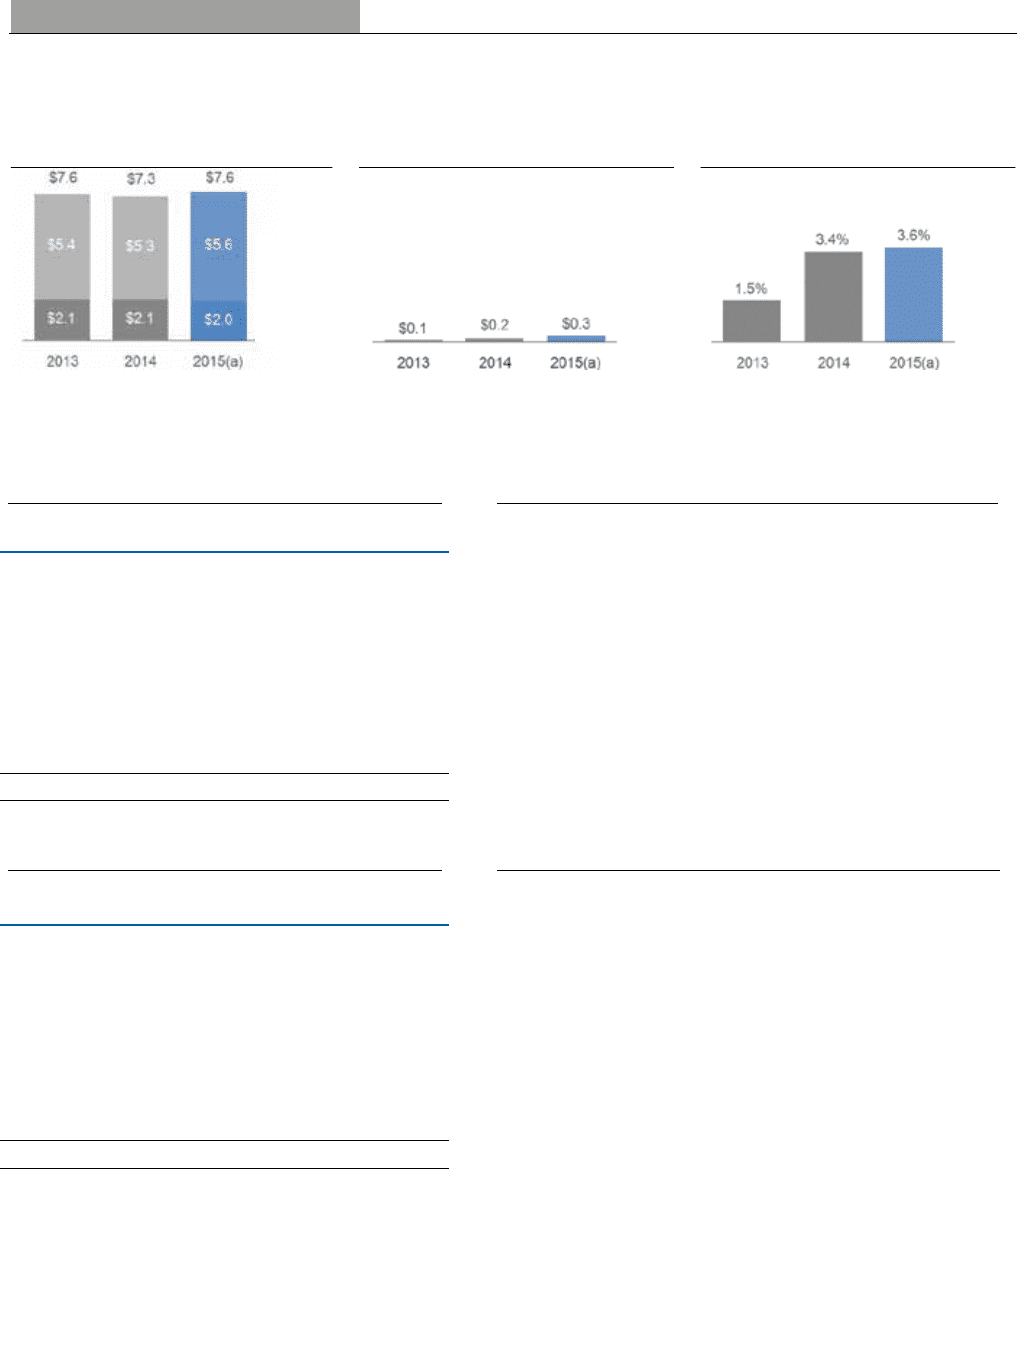
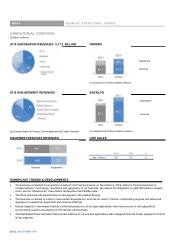
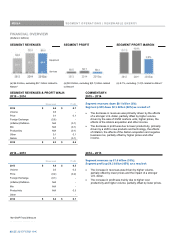
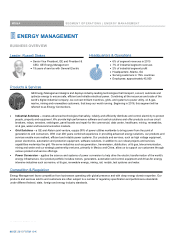
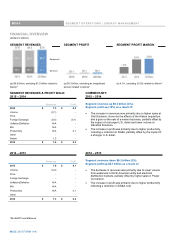
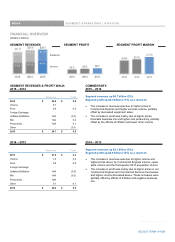
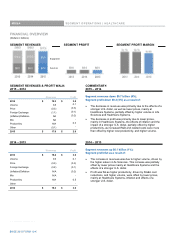
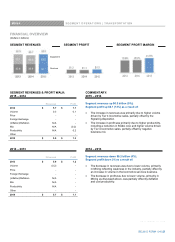
MD&A SEGMENT OPERATIONS | ENERGY MANAGEMENT
48 GE 2015 FORM 10-K
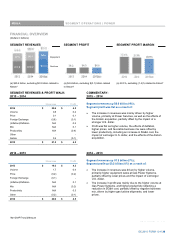
FINANCIAL OVERVIEW
(Dollars in billions)
SEGMENT REVENUES SEGMENT PROFIT SEGMENT PROFIT MARGIN
(a) $6.6 billion, excluding $1.0 billion related to
A
lstom*
(a) $0.3 billion, excluding an insignificant
amount related to Alstom*
(a) 4.1%, excluding (0.5)% related to Alstom*
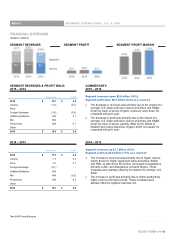
SEGMENT REVENUES & PROFIT WALK: COMMENTARY:
2015 ± 2014 2015 ± 2014
Segment revenues up $0.3 billion (4%);
Segment profit up (10%) as a result of:
x The increase in revenues was primarily due to higher sales at
Grid Solutions, driven by the effects of the Alstom acquisition,
and a gain on the sale of a meters business, partially offset by
the impact of a stronger U.S. dollar and lower volume at
Industrial Solutions.
x The increase in profit was primarily due to higher productivity,
including a reduction in SG&A, partially offset by the impact of
a stronger U.S. dollar.
Revenues Profit
2014 $ 7.3 $ 0.2
Volume (0.1) -
Price - -
Foreign Exchange (0.5) (0.1)
(Inflation)/Deflation N/A -
Mix N/A -
Productivity N/A 0.1
Other - -
Alstom 1.0 -
2015 $ 7.6 $ 0.3
2014 ± 2013 2014 ± 2013
Segment revenues down $0.3 billion (3%);
Segment profit up $0.1 billion as a result of:
x The decrease in revenues was primarily due to lower volume
from weakness in North American utility and electrical
distribution markets, partially offset by higher sales in Power
Conversion.
x The increase in profit was primarily due to higher productivity
reflecting a reduction in SG&A cost.
Revenues Profit
2013 $ 7.6 $ 0.1
Volume (0.2) -
Price - -
Foreign Exchange - -
(Inflation)/Deflation N/A -
Mix N/A -
Productivity N/A 0.1
Other - -
2014 $ 7.3 $ 0.2
*Non-GAAP Financial Measure
Equipment
Services
48 GE 2015 FORM 10-K