GE 2015 Annual Report Download - page 64
Download and view the complete annual report
Please find page 64 of the 2015 GE annual report below. You can navigate through the pages in the report by either clicking on the pages listed below, or by using the keyword search tool below to find specific information within the annual report.-
 1
1 -
2
-
3
-
4
-
5
-
6
-
7
-
8
-
9
-
10
-
11
-
12
-
13
-
14
-
15
-
16
-
17
-
18
-
19
-
20
-
21
-
22
-
23
-
24
-
25
-
26
-
27
-
28
-
29
-
30
-
31
-
32
-
33
-
34
-
35
-
36
-
37
-
38
-
39
-
40
-
41
-
42
-
43
-
44
-
45
-
46
-
47
-
48
-
49
-
50
-
51
-
52
-
53
-
 54
54 -
 55
55 -
 56
56 -
 57
57 -
 58
58 -
 59
59 -
 60
60 -
 61
61 -
 62
62 -
 63
63 -
 64
64 -
 65
65 -
 66
66 -
 67
67 -
 68
68 -
 69
69 -
 70
70 -
 71
71 -
 72
72 -
 73
73 -
 74
74 -
75
-
76
-
77
-
78
-
79
-
80
-
81
-
82
-
83
-
84
-
85
-
86
-
87
-
88
-
89
-
90
-
91
-
92
-
93
-
94
-
95
-
96
-
97
-
98
-
99
-
100
-
101
-
102
-
103
-
104
-
105
-
106
-
107
-
108
-
109
-
110
-
111
-
112
-
113
-
114
-
115
-
116
-
117
-
118
-
119
-
120
-
121
-
122
-
123
-
124
-
125
-
126
-
127
-
128
-
129
-
130
-
131
-
132
-
133
-
134
-
135
-
136
-
137
-
138
-
139
-
140
-
141
-
142
-
143
-
144
-
145
-
146
-
147
-
148
-
149
-
150
-
151
-
152
-
153
-
154
-
155
-
156
-
157
-
158
-
159
-
160
-
161
-
162
-
163
-
164
-
165
-
166
-
167
-
168
-
169
-
170
-
171
-
172
-
173
-
174
-
175
-
176
-
177
-
178
-
179
-
180
-
181
-
182
-
183
-
184
-
185
-
186
-
187
-
188
-
189
-
190
-
191
-
192
-
193
-
194
-
195
-
196
-
197
-
198
-
199
-
200
-
201
-
202
-
203
-
204
-
205
-
206
-
207
-
208
-
209
-
210
-
211
-
212
-
213
-
214
-
215
-
216
-
217
-
218
-
219
-
220
-
221
-
222
-
223
-
224
-
225
-
226
-
227
-
228
-
229
-
230
-
231
-
232
-
233
-
234
-
235
-
236
-
237
-
238
-
239
-
240
-
241
-
242
-
243
-
244
-
245
-
246
-
247
-
248
-
249
-
250
-
251
-
252
 |
 |
MD&A SEGMENT OPERATIONS
36 GE 2015 FORM 10-K
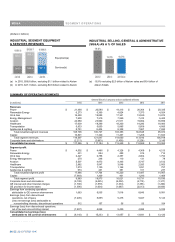
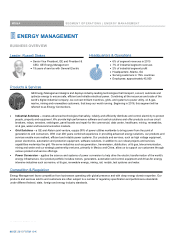
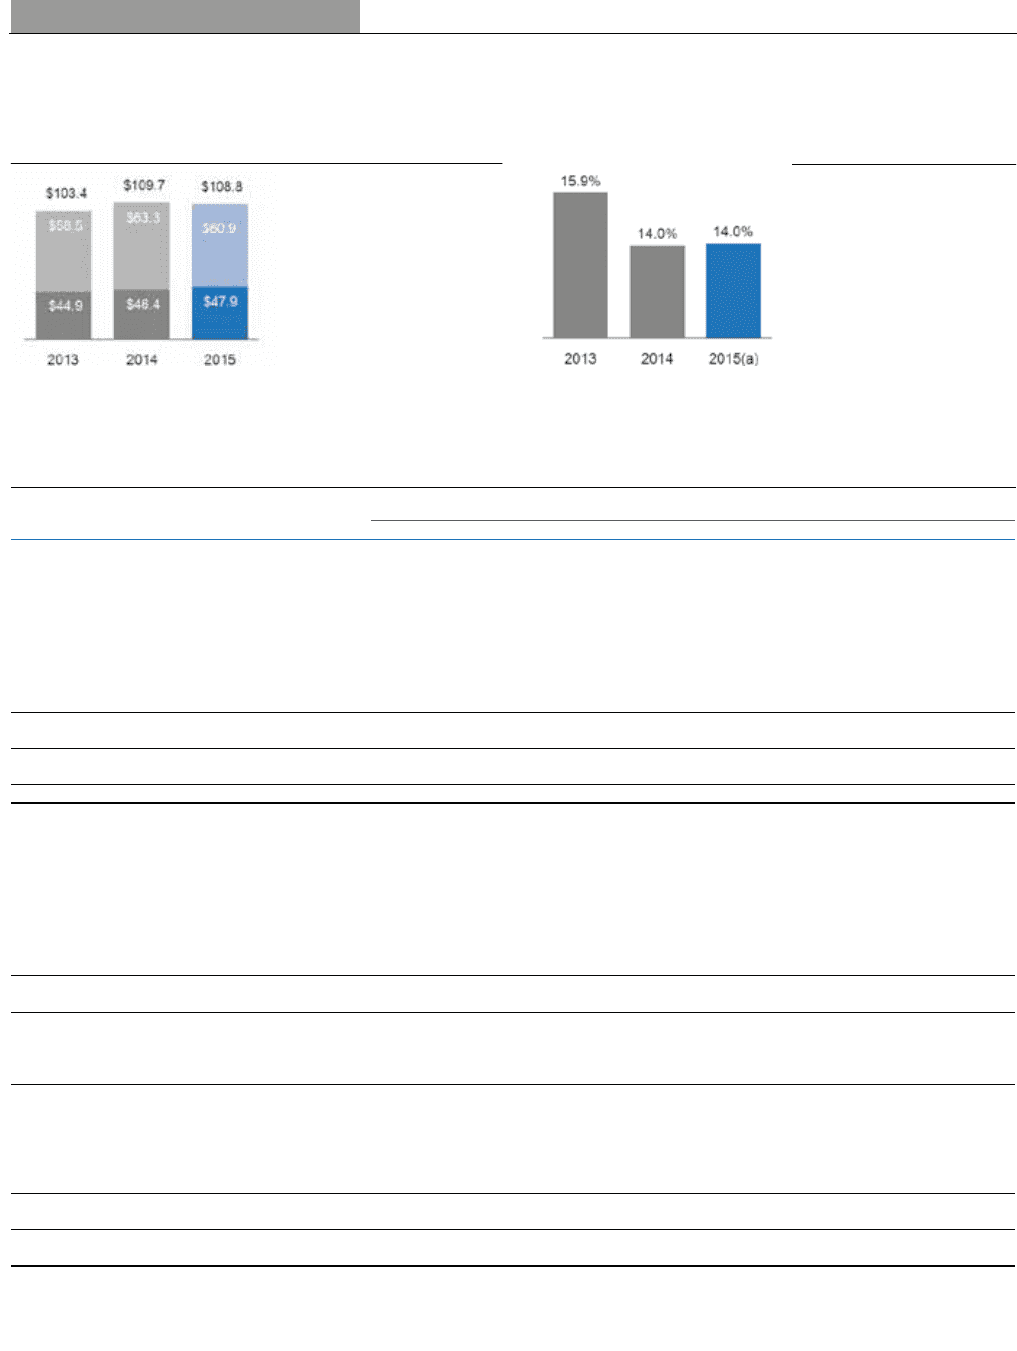
(Dollars in billions)
INDUSTRIAL SEGMENT EQUIPMENT
& SERVICES REVENUES
INDUSTRIAL SELLING, GENERAL & ADMINISTRATIVE
(SG&A) AS A % OF SALES
(a) In 2015, $59.8 billion, excluding $1.1 billion related to Alstom
(b) In 2015, $47.1 billion, excluding $0.8 billion related to Alstom
(a) 13.9% excluding $2.0 billion of Alstom sales and $0.4 billion of
Alstom SG&A
SUMMARY OF OPERATING SEGMENTS
General Electric Company and consolidated affiliates
(In millions) 2015 201
4
2013 2012 2011
Revenues
Power $ 21,490 $ 20,580 $ 19,315 $ 20,364 $ 20,335
Renewable Energy 6,273 6,399 4,824 7,373 4,924
Oil & Gas 16,450 19,085 17,341 15,539 13,874
Energy Management 7,600 7,319 7,569 7,412 6,422
A
viation 24,660 23,990 21,911 19,994 18,859
Healthcare 17,639 18,299 18,200 18,290 18,083
Transportation 5,933 5,650 5,885 5,608 4,885
A
ppliances & Lighting 8,751 8,404 8,338 7,967 7,692
Total industrial segment revenues 108,796 109,727 103,383 102,548 95,074
Capital 10,801 11,320 11,267 11,268 11,843
Total segment revenues 119,597 121,047 114,650 113,816 106,918
Corporate items and eliminations (2,211) (3,863) (1,405) (1,228) 3,145
Consolidated revenues $ 117,386 $ 117,184 $ 113,245 $ 112,588 $ 110,062
Segment profit
Power $ 4,502 $ 4,486 $ 4,328 $ 4,368 $ 4,213
Renewable Energy 431 694 485 914 714
Oil & Gas 2,427 2,758 2,357 2,064 1,754
Energy Management 270 246 110 131 78
A
viation 5,507 4,973 4,345 3,747 3,512
Healthcare 2,882 3,047 3,048 2,920 2,803
Transportation 1,273 1,130 1,166 1,031 757
A
ppliances & Lighting 674 431 381 311 237
Total industrial segment profit 17,966 17,764 16,220 15,487 14,067
Capital (7,983) 1,209 401 1,245 1,469
Total segment profit 9,983 18,973 16,621 16,731 15,536
Corporate items and eliminations (5,108) (6,225) (6,002) (4,719) (1,317)
GE interest and other financial charges (1,706) (1,579) (1,333) (1,353) (1,299)
GE provision for income taxes (1,506) (1,634) (1,667) (2,013) (4,839)
Earnings from continuing operations
attributable to GE common shareowners 1,663 9,535 7,618 8,646 8,081
Earnings (loss) from discontinued
operations, net of taxes (7,495) 5,855 5,475 5,047 5,143
Less net earnings (loss) attributable to
noncontrolling interests, discontinued operations 312 157 36 53 104
Earnings (loss) from discontinued operations,
net of tax and noncontrolling interest (7,807) 5,698 5,439 4,995 5,039
Consolidated net earnings (loss)
attributable to GE common shareowners $ (6,145) $ 15,233 $ 13,057 $ 13,641 $ 13,120
Equipment(a)
Services(b)
36 GE 2015 FORM 10-K