GE 2015 Annual Report Download - page 42
Download and view the complete annual report
Please find page 42 of the 2015 GE annual report below. You can navigate through the pages in the report by either clicking on the pages listed below, or by using the keyword search tool below to find specific information within the annual report.-
 1
1 -
2
-
3
-
4
-
5
-
6
-
7
-
8
-
9
-
10
-
11
-
12
-
13
-
14
-
15
-
16
-
17
-
18
-
19
-
20
-
21
-
22
-
23
-
24
-
25
-
26
-
27
-
28
-
29
-
30
-
31
-
 32
32 -
 33
33 -
 34
34 -
 35
35 -
 36
36 -
 37
37 -
 38
38 -
 39
39 -
 40
40 -
 41
41 -
 42
42 -
 43
43 -
 44
44 -
 45
45 -
 46
46 -
 47
47 -
 48
48 -
 49
49 -
 50
50 -
 51
51 -
 52
52 -
53
-
54
-
55
-
56
-
57
-
58
-
59
-
60
-
61
-
62
-
63
-
64
-
65
-
66
-
67
-
68
-
69
-
70
-
71
-
72
-
73
-
74
-
75
-
76
-
77
-
78
-
79
-
80
-
81
-
82
-
83
-
84
-
85
-
86
-
87
-
88
-
89
-
90
-
91
-
92
-
93
-
94
-
95
-
96
-
97
-
98
-
99
-
100
-
101
-
102
-
103
-
104
-
105
-
106
-
107
-
108
-
109
-
110
-
111
-
112
-
113
-
114
-
115
-
116
-
117
-
118
-
119
-
120
-
121
-
122
-
123
-
124
-
125
-
126
-
127
-
128
-
129
-
130
-
131
-
132
-
133
-
134
-
135
-
136
-
137
-
138
-
139
-
140
-
141
-
142
-
143
-
144
-
145
-
146
-
147
-
148
-
149
-
150
-
151
-
152
-
153
-
154
-
155
-
156
-
157
-
158
-
159
-
160
-
161
-
162
-
163
-
164
-
165
-
166
-
167
-
168
-
169
-
170
-
171
-
172
-
173
-
174
-
175
-
176
-
177
-
178
-
179
-
180
-
181
-
182
-
183
-
184
-
185
-
186
-
187
-
188
-
189
-
190
-
191
-
192
-
193
-
194
-
195
-
196
-
197
-
198
-
199
-
200
-
201
-
202
-
203
-
204
-
205
-
206
-
207
-
208
-
209
-
210
-
211
-
212
-
213
-
214
-
215
-
216
-
217
-
218
-
219
-
220
-
221
-
222
-
223
-
224
-
225
-
226
-
227
-
228
-
229
-
230
-
231
-
232
-
233
-
234
-
235
-
236
-
237
-
238
-
239
-
240
-
241
-
242
-
243
-
244
-
245
-
246
-
247
-
248
-
249
-
250
-
251
-
252
 |
 |
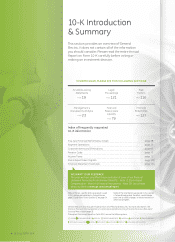
1. Excluding liquidity and including assets of discontinued operations. Non-GAAP Financial Measure. See Financial Measures That Supplement U.S. Generally Accepted Accounting Principles Measures
(Non-GAAP Financial Measures) on page 95.
2. Subject to customary closing conditions.
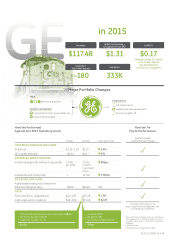
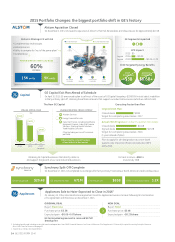
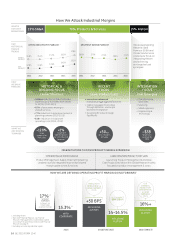
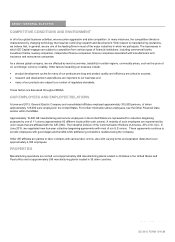
2015 Portfolio Changes: the biggest portfolio shift in GE’s history
Alstom Aquisition Closed
On November 2, 2015, GE closed its aquisition of Alstom’s Thermal, Renewables & Grid businesses for approximately $10.1B.
ORIGINAL DEAL
Buyer: Electrolux
Purchase price: $3.3B
Expected gain: ~$0.05–0.07/share
GE terminated agreement & received $175M
breakup fee
NEW DEAL
Buyer: Haier
Purchase price: $5.4B
Expected gain: ~$0.20/share
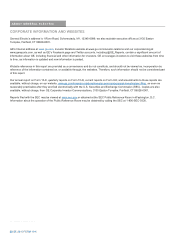
GE Capital Exit Plan Ahead of Schedule
On April 10, 2015, GE announced a plan to sell most of the assets of GE Capital (targeting ~$200B ENI in total sales), in addition
to the Synchrony split-off, retaining those financial assets that support our industrial businesses (which we call Verticals).
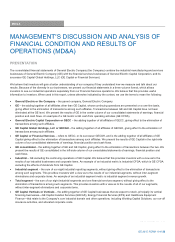
Synchrony Split-Off Complete
On November 17, 2015, GE completed its exchange offer for Synchrony Financial (our North American credit card business).
Appliances Sale to Haier Expected to Close in 20162
On January 15, 2016, GE entered into an agreement to sell its Appliances business to Haier following GE’s termination
of its agreement with Electrolux on December 7, 2015.
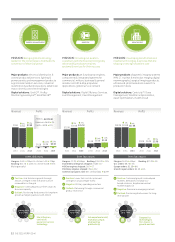
Share buyback $20.4B GE shares retired 671M ENI reduction $65B Offer oversubscribed 3.2X
Alstom’s Strategic Fit with GE
• Complementary technologies
• Global presence
• Ability to compete for “rest of the power plant”
• Installed base
Retaining GE Capital businesses that directly relate to,
and support the growth of, our core industrial businesses
(targeted)
On track to return ~$35B to
investors by 2018
GE Segments Impacted
EPS Impact
POWER SERVICES INSTALLED BASE
60%
increase
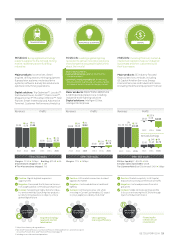
Executing Faster than Plan
Actual 2015 Progress (on a fourth-quarter 2014 basis):
Closed deals $104B
Signed deals $157B
Target for completing asset sales: 2016
(1 year ahead of plan)
Plan to apply for de-designation as a non-bank
systemically important financial institution (SIFI)
early 2016
Original 2015 Plan:
Closed deals $90B
Target for completing asset sales: 2017
COST
SYNERGIES
~$3B
GROWTH
SYNERGIES
$0.6B+
2015 $0
Targeted 2016 ~$0.05
Targeted 2018 ~$0.15–0.20
Capital
Appliances
2020 Targeted Synergy Benefits
15K units 9K units
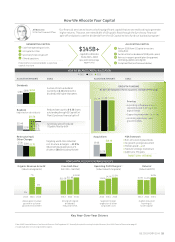
The New GE Capital
VALUABLE INDUSTRIAL FINANCE COMPANY
Aviation Services
Energy Financial Services
Industrial Finance, including Healthcare
Equipment Finance , Industrial Finance
Solutions, Working Capital Solutions,
Trade Payables Solutions
Other (including our run-off insurance
portfolio)
SMALLER, SIMPLER, SAFER
ENI1
2014 2015 2017
≤$90B
$167B
$363B
Enhancing the competitiveness
of our industrial businesses
• GE CONTRIBUTION • ALSTOM CONTRIBUTION
GRID
SOLUTION
STEAM
TURBINE
HEAT
RECOVERY
STEAM
GENERATOR
STEAM TURBINE
GENERATOR
GAS TURBINE
GENERATOR
GAS
TURBINE
14 GE 2015 FORM 10-K