GE 2015 Annual Report Download - page 40
Download and view the complete annual report
Please find page 40 of the 2015 GE annual report below. You can navigate through the pages in the report by either clicking on the pages listed below, or by using the keyword search tool below to find specific information within the annual report.-
 1
1 -
2
-
3
-
4
-
5
-
6
-
7
-
8
-
9
-
10
-
11
-
12
-
13
-
14
-
15
-
16
-
17
-
18
-
19
-
20
-
21
-
22
-
23
-
24
-
25
-
26
-
27
-
28
-
29
-
 30
30 -
 31
31 -
 32
32 -
 33
33 -
 34
34 -
 35
35 -
 36
36 -
 37
37 -
 38
38 -
 39
39 -
 40
40 -
 41
41 -
 42
42 -
 43
43 -
 44
44 -
 45
45 -
 46
46 -
 47
47 -
 48
48 -
 49
49 -
 50
50 -
51
-
52
-
53
-
54
-
55
-
56
-
57
-
58
-
59
-
60
-
61
-
62
-
63
-
64
-
65
-
66
-
67
-
68
-
69
-
70
-
71
-
72
-
73
-
74
-
75
-
76
-
77
-
78
-
79
-
80
-
81
-
82
-
83
-
84
-
85
-
86
-
87
-
88
-
89
-
90
-
91
-
92
-
93
-
94
-
95
-
96
-
97
-
98
-
99
-
100
-
101
-
102
-
103
-
104
-
105
-
106
-
107
-
108
-
109
-
110
-
111
-
112
-
113
-
114
-
115
-
116
-
117
-
118
-
119
-
120
-
121
-
122
-
123
-
124
-
125
-
126
-
127
-
128
-
129
-
130
-
131
-
132
-
133
-
134
-
135
-
136
-
137
-
138
-
139
-
140
-
141
-
142
-
143
-
144
-
145
-
146
-
147
-
148
-
149
-
150
-
151
-
152
-
153
-
154
-
155
-
156
-
157
-
158
-
159
-
160
-
161
-
162
-
163
-
164
-
165
-
166
-
167
-
168
-
169
-
170
-
171
-
172
-
173
-
174
-
175
-
176
-
177
-
178
-
179
-
180
-
181
-
182
-
183
-
184
-
185
-
186
-
187
-
188
-
189
-
190
-
191
-
192
-
193
-
194
-
195
-
196
-
197
-
198
-
199
-
200
-
201
-
202
-
203
-
204
-
205
-
206
-
207
-
208
-
209
-
210
-
211
-
212
-
213
-
214
-
215
-
216
-
217
-
218
-
219
-
220
-
221
-
222
-
223
-
224
-
225
-
226
-
227
-
228
-
229
-
230
-
231
-
232
-
233
-
234
-
235
-
236
-
237
-
238
-
239
-
240
-
241
-
242
-
243
-
244
-
245
-
246
-
247
-
248
-
249
-
250
-
251
-
252
 |
 |
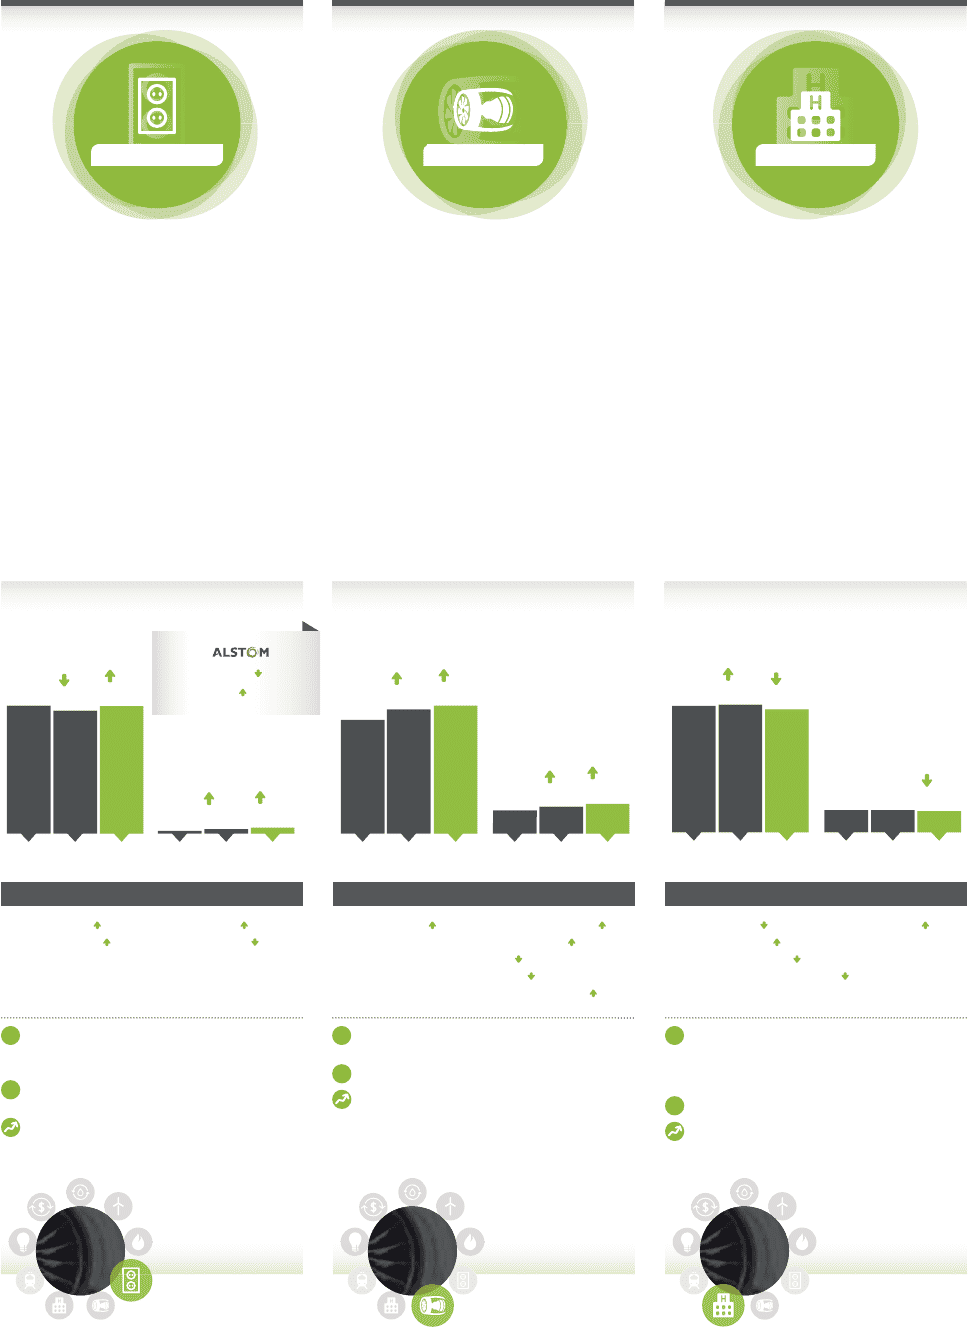
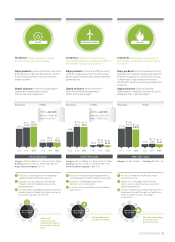
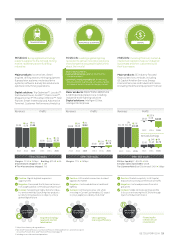
AVIATIONENERGY MANAGEMENT
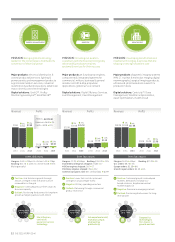
MISSION: Developing transformational
medical technologies & services that are
shaping a new age of patient care
Major products: diagnostic imaging systems
(MRI, CT, nuclear & molecular imaging, digital
mammography), surgical imaging products,
ultrasound, pharmaceutical research &
production tools
Digital solutions: Centricity™, Dose
Management, Workforce Optimization,
Asset Optimization, Health Cloud
MISSION: Being a global technology
leader for the transmission, distribution &
conversion of electrical power
Major products: electrical distribution &
control products & services, lighting &
power panels, grid management products
& grid modernization services, industrial
automation & software solutions, advanced
motor, drive & control technologies
Digital solutions: Grid IQ™, Proficy
Monitoring & Analysis™, SmallWorld™
Revenues Profits Revenues Profits Revenues Profits
MISSION: Providing our aviation
customers with the most technologically
advanced & productive engines,
systems & services for their success
Major products: jet & turboprop engines,
components & integrated systems for
commercial, military, business & general
aviation aircraft & ship propulsion
applications, global service network
Digital solutions: Flight Efficiency Services,
Fuel Management, Fleet Management
Margins: 16.3% 40bps Backlog: $17.2B 4%
U.S. orders: $8.7B 1%
Europe orders: $3.5B 8%
Growth region orders: $5.3B 6%
Margins: 3.6% 20bps Ex. Alstom 4.1% 70bps
Backlog: $11.7B 134% Ex. Alstom $3.4B 33%
(flat organically)
Margins: 22.3% 160bps Backlog: $151.2B 13%
# commercial engines shipped: 2,588 17
# GEnx engines shipped: 260 27
# military engines shipped: 766 302
Commercial spares rate: $37.1 million/day $6.9M
Other 2015 resultsOther 2015 results Other 2015 results
HEALTHCARE
Advanced materials/
manufacturing &
engineering
productivity
Diagnostics
technology &
first-mover in
growth markets
Electrification,
controls &
power conversion
technology
+ Positive: Grid Solutions growth through
Alstom, strength in electrification & more
renewables on the grid
– Negative: Continued pressure from oil prices
& excess capacity
Outlook: Positioning the business for long-term
growth & margin expansion with Alstom
+ Positive: Continued growth in developed
markets, demand for IT/analytics-
based solutions, biopharmaceutical
market expansion
– Negative: Pressure in emerging markets
Outlook: Positioning the business for long-
term growth
+ Positive: Lower fuel costs & continued
strength in air passenger traffic
– Negative: Military spending uncertain
Outlook: Delivering through commercial
product transition
term
growth
2015 Ex.
Revenues = $6.6B 9%
Profits = $0.3B 12%
CONTRIBUTION
TO GE STORE
CONTRIBUTION
TO GE STORE
CONTRIBUTION
TO GE STORE
$18.2B 4%
$17.6B
$3.0B
0%
$3.0B
1%
$18.3B
2013 2014 2015 2013 2014 2015
5%
$2.9B
$21.9B
9%
$24.0B
3%
$24.7B
$4.3B
14%
$5.0B
2013 2014 2015 2013 2014 2015
11%
$5.5B
3%
$7.3B
$7.6B
$0.1B
10%
$0.3B
124%
$0.2B
2014 2015 2013 2014 2015
2013
4%
$7.6B
12 GE 2015 FORM 10-K