GE 2015 Annual Report Download - page 118
Download and view the complete annual report
Please find page 118 of the 2015 GE annual report below. You can navigate through the pages in the report by either clicking on the pages listed below, or by using the keyword search tool below to find specific information within the annual report.-
 1
1 -
2
-
3
-
4
-
5
-
6
-
7
-
8
-
9
-
10
-
11
-
12
-
13
-
14
-
15
-
16
-
17
-
18
-
19
-
20
-
21
-
22
-
23
-
24
-
25
-
26
-
27
-
28
-
29
-
30
-
31
-
32
-
33
-
34
-
35
-
36
-
37
-
38
-
39
-
40
-
41
-
42
-
43
-
44
-
45
-
46
-
47
-
48
-
49
-
50
-
51
-
52
-
53
-
54
-
55
-
56
-
57
-
58
-
59
-
60
-
61
-
62
-
63
-
64
-
65
-
66
-
67
-
68
-
69
-
70
-
71
-
72
-
73
-
74
-
75
-
76
-
77
-
78
-
79
-
80
-
81
-
82
-
83
-
84
-
85
-
86
-
87
-
88
-
89
-
90
-
91
-
92
-
93
-
94
-
95
-
96
-
97
-
98
-
99
-
100
-
101
-
102
-
103
-
104
-
105
-
106
-
107
-
 108
108 -
 109
109 -
 110
110 -
 111
111 -
 112
112 -
 113
113 -
 114
114 -
 115
115 -
 116
116 -
 117
117 -
 118
118 -
 119
119 -
 120
120 -
 121
121 -
 122
122 -
 123
123 -
 124
124 -
 125
125 -
 126
126 -
 127
127 -
 128
128 -
129
-
130
-
131
-
132
-
133
-
134
-
135
-
136
-
137
-
138
-
139
-
140
-
141
-
142
-
143
-
144
-
145
-
146
-
147
-
148
-
149
-
150
-
151
-
152
-
153
-
154
-
155
-
156
-
157
-
158
-
159
-
160
-
161
-
162
-
163
-
164
-
165
-
166
-
167
-
168
-
169
-
170
-
171
-
172
-
173
-
174
-
175
-
176
-
177
-
178
-
179
-
180
-
181
-
182
-
183
-
184
-
185
-
186
-
187
-
188
-
189
-
190
-
191
-
192
-
193
-
194
-
195
-
196
-
197
-
198
-
199
-
200
-
201
-
202
-
203
-
204
-
205
-
206
-
207
-
208
-
209
-
210
-
211
-
212
-
213
-
214
-
215
-
216
-
217
-
218
-
219
-
220
-
221
-
222
-
223
-
224
-
225
-
226
-
227
-
228
-
229
-
230
-
231
-
232
-
233
-
234
-
235
-
236
-
237
-
238
-
239
-
240
-
241
-
242
-
243
-
244
-
245
-
246
-
247
-
248
-
249
-
250
-
251
-
252
 |
 |

MD&A CRITICAL ACCOUNTING ESTIMATES
90 GE 2015 FORM 10-K
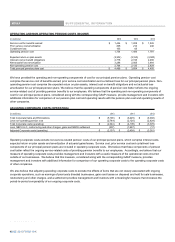
To determine the expected long-term rate of return on pension plan assets, we consider current and target asset allocations, as well as
historical and expected returns on various categories of plan assets. In developing future long-term return expectations for our principal
EHQHILWSODQV¶DVVHWVZHIRUPXODWHYLHZVRQWKHIXWXUHHFRQRPLFHQYLURQPHQWERWKLQWKH86DQGDEURDG We evaluate general
market trends and historical relationships among a number of key variables that impact asset class returns such as expected earnings
growth, inflation, valuations, yields and spreads, using both internal and external sources. We also take into account expected volatility
by asset class and diversification across classes to determine expected overall portfolio results given current and target allocations.
Assets in our principal pension plans earned 0.6% in 2015, and had average annual returns of 6.4%, 5.0%, and 8.5% per year in the 5-,
10- and 25-year periods ended December 31, 2015, respectively. The average historical 10- and 25- year returns were significantly
affected by investment losses in 2008. Based on our analysis of future expectations of asset performance, past return results, and our
current and target asset allocations, we have assumed a 7.5% long-term expected return on those assets for cost recognition in 2016
compared to 7.5% in 2015 and 2014 and 8.0% in 2013.
Changes in key assumptions for our principal pension plans would have the following effects.
x Discount rate ± A 25 basis point increase in discount rate would decrease pension cost in the following year by $0.2 billion and
would decrease the pension benefit obligation at year-end by about $2.2 billion.
x Expected return on assets ± A 50 basis point decrease in the expected return on assets would increase pension cost in the
following year by $0.2 billion.
Further information on our pension plans is provided in the Other Consolidated Information ± Postretirement Benefit Plans section
within the MD&A and in Note 12 and 27 to the consolidated financial statements.
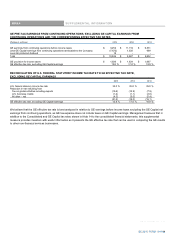
INCOME TAXES
Our annual tax rate is based on our income, statutory tax rates and tax planning opportunities available to us in the various jurisdictions
in which we operate. Tax laws are complex and subject to different interpretations by the taxpayer and respective governmental taxing
authorities. Significant judgment is required in determining our tax expense and in evaluating our tax positions, including evaluating
uncertainties. We review our tax positions quarterly and adjust the balances as new information becomes available. Our income tax
rate is significantly affected by the tax rate on our global operations. In addition to local country tax laws and regulations, this rate
depends on the extent earnings are indefinitely reinvested outside the United States. Indefinite reinvestment is determined by
PDQDJHPHQW¶VMXGJPHQWDERXWDQGLQWHQWLRQVFRQFHUQLQJWKHfuture operations of the Company. At December 31, 2015 and 2014,
approximately $104 billion and $119 billion of earnings, respectively, have been indefinitely reinvested outside the United States. Most
of these earnings have been reinvested in active non-U.S. business operations, and we do not intend to repatriate these earnings to
fund U.S. operations. Because of the availability of U.S. foreign tax credits, it is not practicable to determine the U.S. federal income tax
liability that would be payable if such earnings were not reinvested indefinitely.
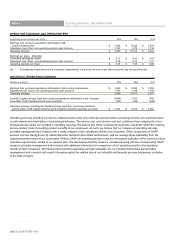
Deferred income tax assets represent amounts available to reduce income taxes payable on taxable income in future years. Such
assets arise because of temporary differences between the financial reporting and tax bases of assets and liabilities, as well as from
net operating loss and tax credit carryforwards. We evaluate the recoverability of these future tax deductions and credits by assessing
the adequacy of future expected taxable income from all sources, including reversal of taxable temporary differences, forecasted
operating earnings and available tax planning strategies. These sources of income rely heavily on estimates. We use our historical
experience and our short- and long-range business forecasts to provide insight. Further, our global and diversified business portfolio
gives us the opportunity to employ various prudent and feasible tax planning strategies to facilitate the recoverability of future
deductions. Amounts recorded for deferred tax assets related to non-U.S. net operating losses, net of valuation allowances, were $5.1
billion and $5.5 billion at December 31, 2015 and 2014, including $0.8 billion and $1.7 billion at December 31, 2015 and 2014,
respectively, of deferred tax assets, net of valuation allowances, associated with losses reported in discontinued operations, primarily
related to our Real Estate and Consumer businesses and our loss on the sale of GE Money Japan. Such year-end 2015 amounts are
expected to be fully recoverable within the applicable statutory expiration periods. To the extent we do not consider it more likely than
not that a deferred tax asset will be recovered, a valuation allowance is established.
Further information on income taxes is provided in the Other Consolidated Information ± Income Taxes section within the MD&A and in
Note 14 to the consolidated financial statements.
90 GE 2015 FORM 10-K