GE 2015 Annual Report Download - page 38
Download and view the complete annual report
Please find page 38 of the 2015 GE annual report below. You can navigate through the pages in the report by either clicking on the pages listed below, or by using the keyword search tool below to find specific information within the annual report.-
 1
1 -
2
-
3
-
4
-
5
-
6
-
7
-
8
-
9
-
10
-
11
-
12
-
13
-
14
-
15
-
16
-
17
-
18
-
19
-
20
-
21
-
22
-
23
-
24
-
25
-
26
-
27
-
 28
28 -
 29
29 -
 30
30 -
 31
31 -
 32
32 -
 33
33 -
 34
34 -
 35
35 -
 36
36 -
 37
37 -
 38
38 -
 39
39 -
 40
40 -
 41
41 -
 42
42 -
 43
43 -
 44
44 -
 45
45 -
 46
46 -
 47
47 -
 48
48 -
49
-
50
-
51
-
52
-
53
-
54
-
55
-
56
-
57
-
58
-
59
-
60
-
61
-
62
-
63
-
64
-
65
-
66
-
67
-
68
-
69
-
70
-
71
-
72
-
73
-
74
-
75
-
76
-
77
-
78
-
79
-
80
-
81
-
82
-
83
-
84
-
85
-
86
-
87
-
88
-
89
-
90
-
91
-
92
-
93
-
94
-
95
-
96
-
97
-
98
-
99
-
100
-
101
-
102
-
103
-
104
-
105
-
106
-
107
-
108
-
109
-
110
-
111
-
112
-
113
-
114
-
115
-
116
-
117
-
118
-
119
-
120
-
121
-
122
-
123
-
124
-
125
-
126
-
127
-
128
-
129
-
130
-
131
-
132
-
133
-
134
-
135
-
136
-
137
-
138
-
139
-
140
-
141
-
142
-
143
-
144
-
145
-
146
-
147
-
148
-
149
-
150
-
151
-
152
-
153
-
154
-
155
-
156
-
157
-
158
-
159
-
160
-
161
-
162
-
163
-
164
-
165
-
166
-
167
-
168
-
169
-
170
-
171
-
172
-
173
-
174
-
175
-
176
-
177
-
178
-
179
-
180
-
181
-
182
-
183
-
184
-
185
-
186
-
187
-
188
-
189
-
190
-
191
-
192
-
193
-
194
-
195
-
196
-
197
-
198
-
199
-
200
-
201
-
202
-
203
-
204
-
205
-
206
-
207
-
208
-
209
-
210
-
211
-
212
-
213
-
214
-
215
-
216
-
217
-
218
-
219
-
220
-
221
-
222
-
223
-
224
-
225
-
226
-
227
-
228
-
229
-
230
-
231
-
232
-
233
-
234
-
235
-
236
-
237
-
238
-
239
-
240
-
241
-
242
-
243
-
244
-
245
-
246
-
247
-
248
-
249
-
250
-
251
-
252
 |
 |
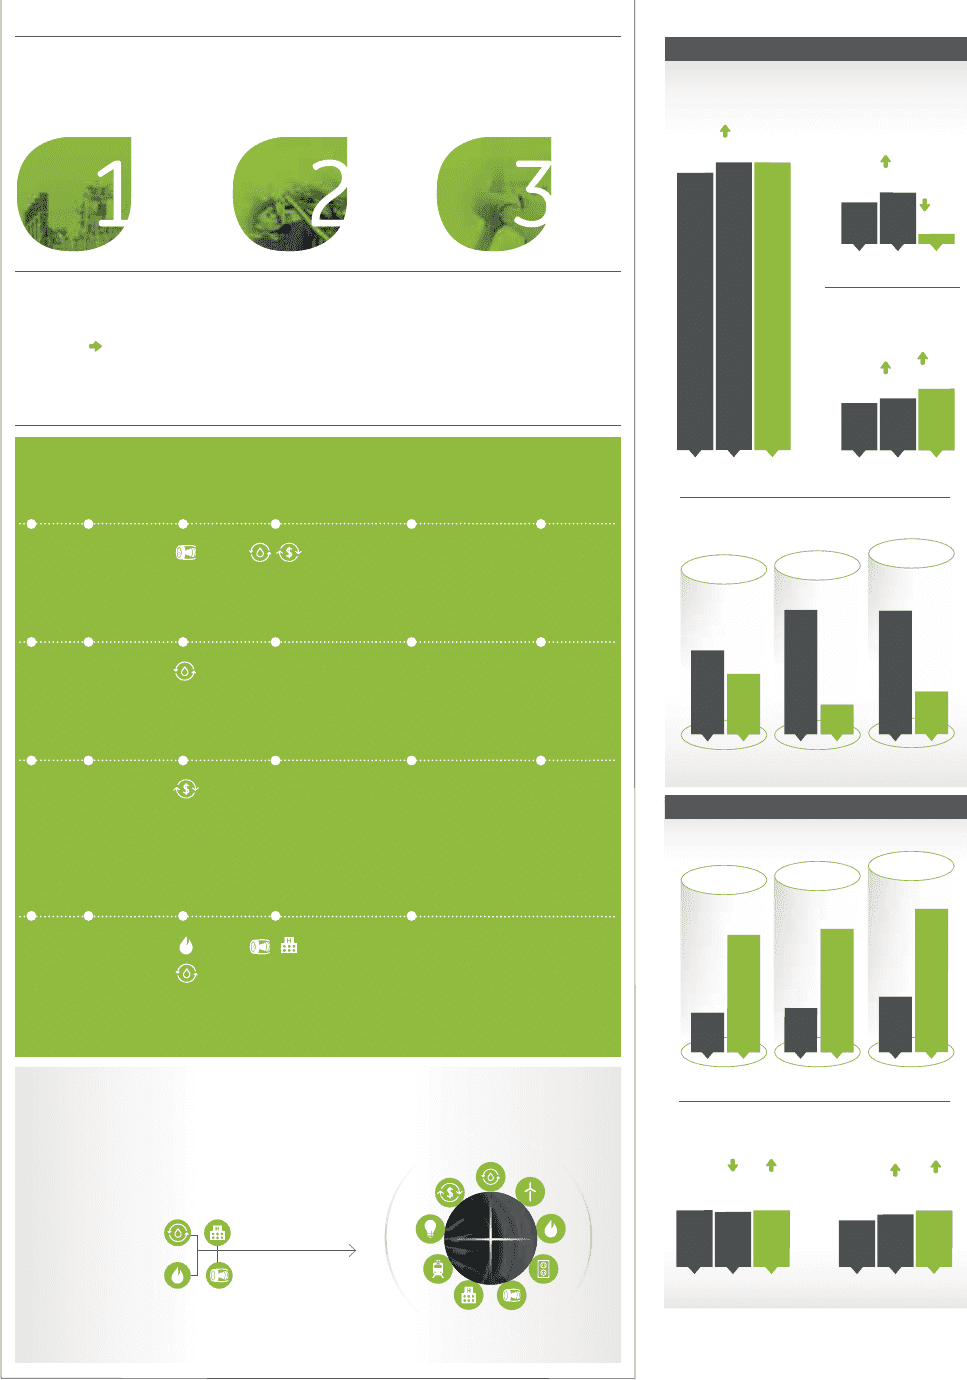
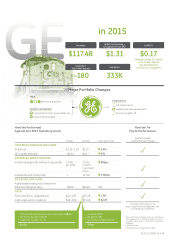
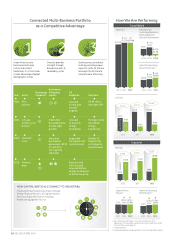
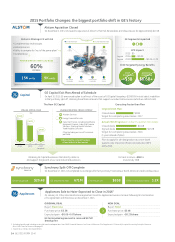
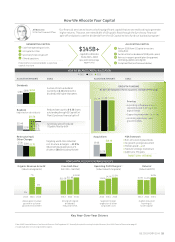
How We Are Performing
Revenues Earnings from
Continuing Operations
Attributable to GE
Common Shareowners
Industrial Operating +
Verticals Earnings1
Industrial Operating
Profit Margins1, 3
GE CFOA
Backlog
Segment Gross
Margins2
Consolidated
Industrial
1. Non-GAAP Financial Measure. See Financial Measures That
Supplement U.S. Generally Accepted Accounting Principles (Non-GAAP
Financial Measures) on page 95.
2. Excluding Alstom.
3. Including Corporate, excluding Alstom, restructuring and other & gains.
$249B $266B $315B
$14.3B $15.2B $16.4B
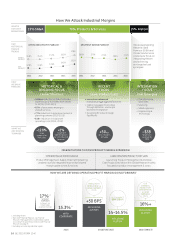
Connected Multi-Business Portfolio
as a Competitive Advantage
Great infrastructure
businesses built upon
technical & market
leadership critical scale
to take advantage of global
demographic trends
Year Event
Businesses
Impacted
Businesses
Mitigating
Impact
GE
Response Outcome
2001 9/11
attacks
Invested
in next-gen
aircraft
engines
GE 90, GEnx,
next-gen CFM
2004 U.S. gas
turbine cycle
bottom
Most other
businesses saw
double-digit
growth
Invested
to diversify
energy
businesses
Stronger, more
diversified
energy
businesses
2009 Financial
crisis
Industrial
businesses
generated ~$17B
of cash flow
(as originally
reported)
Supported
GE Capital with
cash infusions
Smaller GE
Capital that
is stronger &
more focused
2015 Oil price
drop
Restructured
Oil & Gas and
acquired Alstom
energy businesses
at attractive price
Diversity provides
strength through
disruptive events &
commodity cycles
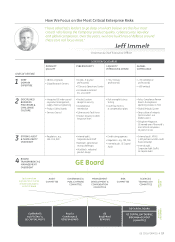
Each business contributes
to GE by providing unique
expertise to the GE Store &
leverages the GE Store to
compete more effectively
Financing infrastructure investments through
Energy Financial Services, GE Capital Aviation
Services & Industrial Finance, including
Healthcare Equipment Finance
HOW CAPITAL VERTICALS CONNECT TO INDUSTRIAL
v
estments t
h
roug
h
G
E Ca
p
ital Aviation
c
e, inc
l
u
d
ing
nc
e
A
L
C
AL
S
CO
NN
EC
T
TO
I
ND
US
TR
IA
A
$113.2B
2013 2014 2015
0%
$117.4B
3%
$117.2B
$7.6B
25%
$9.5B
83%
$1.7B
2013 2014 2015
$10.3B
9%
$11.3B
16%
$13.1B
2013 2014 2015
27.4%
80bps
27.4%
80bps
26.6%
2013 2014 20151
12.6%
110bps
15.3%
160bps
14.2%
2013 2014 2015
$12.1B
$4.3B
2015
$12.2B
$3.0B
2014
$6.0B
$8.3B
2013
$71B
$195B
2014 2015
$226B
$89B
$64B
$185B
2013
S ervices
Equipment
GE Capital
Dividend
Industrial CFOA1
10 GE 2015 FORM 10-K