GE 2015 Annual Report Download - page 163
Download and view the complete annual report
Please find page 163 of the 2015 GE annual report below. You can navigate through the pages in the report by either clicking on the pages listed below, or by using the keyword search tool below to find specific information within the annual report.-
 1
1 -
2
-
3
-
4
-
5
-
6
-
7
-
8
-
9
-
10
-
11
-
12
-
13
-
14
-
15
-
16
-
17
-
18
-
19
-
20
-
21
-
22
-
23
-
24
-
25
-
26
-
27
-
28
-
29
-
30
-
31
-
32
-
33
-
34
-
35
-
36
-
37
-
38
-
39
-
40
-
41
-
42
-
43
-
44
-
45
-
46
-
47
-
48
-
49
-
50
-
51
-
52
-
53
-
54
-
55
-
56
-
57
-
58
-
59
-
60
-
61
-
62
-
63
-
64
-
65
-
66
-
67
-
68
-
69
-
70
-
71
-
72
-
73
-
74
-
75
-
76
-
77
-
78
-
79
-
80
-
81
-
82
-
83
-
84
-
85
-
86
-
87
-
88
-
89
-
90
-
91
-
92
-
93
-
94
-
95
-
96
-
97
-
98
-
99
-
100
-
101
-
102
-
103
-
104
-
105
-
106
-
107
-
108
-
109
-
110
-
111
-
112
-
113
-
114
-
115
-
116
-
117
-
118
-
119
-
120
-
121
-
122
-
123
-
124
-
125
-
126
-
127
-
128
-
129
-
130
-
131
-
132
-
133
-
134
-
135
-
136
-
137
-
138
-
139
-
140
-
141
-
142
-
143
-
144
-
145
-
146
-
147
-
148
-
149
-
150
-
151
-
152
-
 153
153 -
 154
154 -
 155
155 -
 156
156 -
 157
157 -
 158
158 -
 159
159 -
 160
160 -
 161
161 -
 162
162 -
 163
163 -
 164
164 -
 165
165 -
 166
166 -
 167
167 -
 168
168 -
 169
169 -
 170
170 -
 171
171 -
 172
172 -
 173
173 -
174
-
175
-
176
-
177
-
178
-
179
-
180
-
181
-
182
-
183
-
184
-
185
-
186
-
187
-
188
-
189
-
190
-
191
-
192
-
193
-
194
-
195
-
196
-
197
-
198
-
199
-
200
-
201
-
202
-
203
-
204
-
205
-
206
-
207
-
208
-
209
-
210
-
211
-
212
-
213
-
214
-
215
-
216
-
217
-
218
-
219
-
220
-
221
-
222
-
223
-
224
-
225
-
226
-
227
-
228
-
229
-
230
-
231
-
232
-
233
-
234
-
235
-
236
-
237
-
238
-
239
-
240
-
241
-
242
-
243
-
244
-
245
-
246
-
247
-
248
-
249
-
250
-
251
-
252
 |
 |

FINANCIAL STATEMENTS
t
GE 2015 FORM 10-K 135
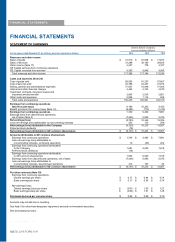
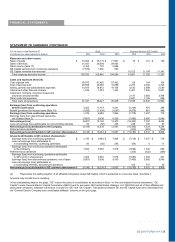
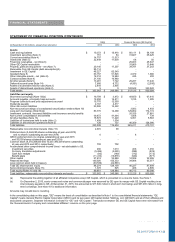
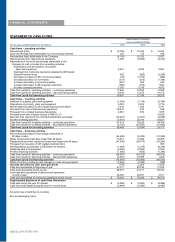
STATEMENT OF CASH FLOWS (CONTINUED)
GE(a) Financial Services (GE Capital)
For the years ended December 31 (In millions) 2015 2014 2013 2015 201
4
2013
Cash flows ± operating activities
Net earnin
g
s
(
loss
)
$
(
6,061
)
$ 15,182 $ 13,303 $
(
15,202
)
$ 7,397 $ 6,256
Less net earnin
g
s
(
loss
)
attributable to noncontrollin
g
interests 83
(
50
)
245 248 162 53
Net earnin
g
s
(
loss
)
attributable to the Com
p
an
y
(
6,145
)
15,233 13,057
(
15,450
)
7,234 6,204
(
Earnin
g
s
)
loss from discontinued operations 7,807
(
5,698
)
(
5,439
)
7,485
(
5,860
)
(
5,540
)
A
d
j
ustments to reconcile net earnin
g
s attributable to the
Compan
y
to cash provided from operatin
g
activities:
Depreciation and amortization of propert
y
,
plant and equipment 2,473 2,508 2,449 2,436 2,529 2,754
Earnin
g
s from continuin
g
operations retained b
y
GE Capital
(
b
)
12,284 1,625 5,321 - - -
Deferred income taxes
(
1,800
)
(
476
)
(
2,571
)
2,183
(
406
)
(
969
)
Decrease
(
increase
)
in GE current receivables 666
(
473
)
(
1,432
)
- - -
Decrease
(
increase
)
in inventories
(
282
)
(
877
)
(
1,351
)
(
14
)
27 33
Increase
(
decrease
)
in accounts pa
y
able 276 884 809
(
189
)
258 155
Increase
(
decrease
)
in GE pro
g
ress collections
(
1,010
)
(
528
)
1,919 - - -
All other operatin
g
activities 2,083 2,973 1,492 5,087 2,480 2,596
Cash from
(
used for
)
o
p
eratin
g
activities ± continuin
g
o
p
erations 16,354 15,171 14,255 1,537 6,263 5,232
Cash from
(
used for
)
operatin
g
activities ± discontinued operations
(
12
)
(
2
)
(
2
)
8,046 11,678 14,113
Cash from
(
used for
)
o
p
eratin
g
activities 16,342 15,169 14,253
9,583 17,941 19,345
Cash flows ± investing activities
A
dditions to propert
y
, plant and equipment
(
3,785
)
(
3,970
)
(
3,680
)
(
4,237
)
(
3,818
)
(
3,274
)
Dispositions of propert
y
, plant and equipment 939 615 381 2,526 2,331 2,335
Net decrease
(
increase
)
in GE Capital financin
g
receivables - - - 226
(
161
)
3,022
Proceeds from sale of discontinued operations - - - 79,615 232 528
Proceeds from principal business dispositions 1,725 602 1,316 532 - 477
Proceeds from sale of equit
y
interest in NBCU LLC - - 16,699 - - -
Net cash from
(
pa
y
ments for
)
principal businesses purchased
(
10,350
)
(
2,091
)
(
8,026
)
(
1,677
)
- -
A
ll other investin
g
activities
(
1,308
)
(
1,062
)
(
1,868
)
(
4,690
)
24,574 35,756
Cash from
(
used for
)
investin
g
activities ± continuin
g
o
p
erations
(
12,779
)
(
5,906
)
4,822 72,295 23,158 38,844
Cash from
(
used for
)
investin
g
activities ± discontinued operations 12 2 2
(
2,137
)
(
24,263
)
(
15,043
)
Cash from
(
used for
)
investin
g
activities
(
12,767
)
(
5,905
)
4,823 70,158
(
1,105
)
23,801
Cash flows ± financing activities
Net increase
(
decrease
)
in borrowin
g
s
(
maturities of
90 da
y
s or less
)
603 243 949
(
24,834
)
(
7,078
)
(
13,710
)
Newl
y
issued debt
(
maturities lon
g
er than 90 da
y
s
)
3,560 3,084 512 10,391 11,545 37,852
Repa
y
ments and other reductions
(
maturities lon
g
er than 90 da
y
s
)
(
2,190
)
(
323
)
(
5,032
)
(
44,848
)
(
38,087
)
(
48,592
)
Proceeds from issuance of GE Capital preferred stock - - - - - 990
Net dispositions
(
purchases
)
of GE shares for treasur
y
(
1,099
)
(
1,218
)
(
9,278
)
- - -
Dividends paid to shareowners
(
9,289
)
(
8,851
)
(
7,821
)
(
4,620
)
(
3,322
)
(
6,283
)
A
ll other financin
g
activities 203 346
(
212
)
(
1,362
)
(
679
)
(
878
)
Cash from
(
used for
)
financin
g
activities ± continuin
g
o
p
erations
(
8,211
)
(
6,719
)
(
20,881
)
(
65,273
)
(
37,621
)
(
30,621
)
Cash from
(
used for
)
financin
g
activities ± discontinued operations - - -
(
6,507
)
23,956 1,239
Cash from
(
used for
)
financin
g
activities
(
8,211
)
(
6,719
)
(
20,881
)
(
71,780
)
(
13,665
)
(
29,382
)
Effect of currenc
y
exchan
g
e rate chan
g
es on cash and e
q
uivalents
(
908
)
(
312
)
(
22
)
(
2,556
)
(
3,180
)
(
773
)
Increase
(
decrease
)
in cash and e
q
uivalents
(
5,544
)
2,234
(
1,827
)
5,406
(
9
)
12,991
Cash and equivalents at be
g
innin
g
of
y
ear 15,916 13,682 15,509 75,100 75,109 62,118
Cash and e
q
uivalents at end of
y
ear 10,372 15,916 13,682 80,506 75,100 75,109
Less cash and equivalents of discontinued operations
at end of year - - - 20,395 20,991 9,617
Cash and e
q
uivalents of continuin
g
o
p
erations at end of
y
ear $ 10,372 $ 15,916 $ 13,682 $ 60,111 $ 54,109 $ 65,492
Su
pp
lemental disclosure of cash flows information
Cash paid durin
g
the
y
ear for interest $
(
1,204
)
$
(
1,215
)
$
(
1,132
)
$
(
8,884
)
$
(
8,910
)
$
(
8,146
)
Cash recovered
(p
aid
)
durin
g
the
y
ear for income taxes
(
1
,
636
)
(
1
,
337
)
(
4
,
753
)
(
850
)
(
1
,
618
)
2
,
266
(a) Represents the adding together of all affiliated companies except GE Capital, which is presented on a one-line basis.
(b) Represents GE Capital earnings/loss from continuing operations attributable to the Company, net of GE Capital dividends paid to GE.
Amounts may not add due to rounding.
In the consolidating data on this page, "GE" means the basis of consolidation as described in Note 1 to the consolidated financial statements; "GE
Capital" means General Electric Capital Corporation (GECC) and its successor GE Capital Global Holdings, LLC (GECGH) and all of their affiliates and
associated companies. Separate information is shown for ³*(´ and ³)LQDQFLDO Services (GE &DSLWDO´ Transactions between GE and GE Capital have
been eliminated from the ³&RQVROLGDWHG´ columns and are discussed in Note 23.
See Note 25 for additional information regarding the Statement of Cash Flows.
GE 2015 FORM 10-K 135