GE 2015 Annual Report Download - page 106
Download and view the complete annual report
Please find page 106 of the 2015 GE annual report below. You can navigate through the pages in the report by either clicking on the pages listed below, or by using the keyword search tool below to find specific information within the annual report.-
 1
1 -
2
-
3
-
4
-
5
-
6
-
7
-
8
-
9
-
10
-
11
-
12
-
13
-
14
-
15
-
16
-
17
-
18
-
19
-
20
-
21
-
22
-
23
-
24
-
25
-
26
-
27
-
28
-
29
-
30
-
31
-
32
-
33
-
34
-
35
-
36
-
37
-
38
-
39
-
40
-
41
-
42
-
43
-
44
-
45
-
46
-
47
-
48
-
49
-
50
-
51
-
52
-
53
-
54
-
55
-
56
-
57
-
58
-
59
-
60
-
61
-
62
-
63
-
64
-
65
-
66
-
67
-
68
-
69
-
70
-
71
-
72
-
73
-
74
-
75
-
76
-
77
-
78
-
79
-
80
-
81
-
82
-
83
-
84
-
85
-
86
-
87
-
88
-
89
-
90
-
91
-
92
-
93
-
94
-
95
-
 96
96 -
 97
97 -
 98
98 -
 99
99 -
 100
100 -
 101
101 -
 102
102 -
 103
103 -
 104
104 -
 105
105 -
 106
106 -
 107
107 -
 108
108 -
 109
109 -
 110
110 -
 111
111 -
 112
112 -
 113
113 -
 114
114 -
 115
115 -
 116
116 -
117
-
118
-
119
-
120
-
121
-
122
-
123
-
124
-
125
-
126
-
127
-
128
-
129
-
130
-
131
-
132
-
133
-
134
-
135
-
136
-
137
-
138
-
139
-
140
-
141
-
142
-
143
-
144
-
145
-
146
-
147
-
148
-
149
-
150
-
151
-
152
-
153
-
154
-
155
-
156
-
157
-
158
-
159
-
160
-
161
-
162
-
163
-
164
-
165
-
166
-
167
-
168
-
169
-
170
-
171
-
172
-
173
-
174
-
175
-
176
-
177
-
178
-
179
-
180
-
181
-
182
-
183
-
184
-
185
-
186
-
187
-
188
-
189
-
190
-
191
-
192
-
193
-
194
-
195
-
196
-
197
-
198
-
199
-
200
-
201
-
202
-
203
-
204
-
205
-
206
-
207
-
208
-
209
-
210
-
211
-
212
-
213
-
214
-
215
-
216
-
217
-
218
-
219
-
220
-
221
-
222
-
223
-
224
-
225
-
226
-
227
-
228
-
229
-
230
-
231
-
232
-
233
-
234
-
235
-
236
-
237
-
238
-
239
-
240
-
241
-
242
-
243
-
244
-
245
-
246
-
247
-
248
-
249
-
250
-
251
-
252
 |
 |

MD&A STATEMENT OF FINANCIAL POSITION
78 GE 2015 FORM 10-K
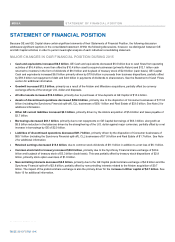
STATEMENT OF FINANCIAL POSITION
Because GE and GE Capital share certain significant elements of their Statements of Financial Position, the following discussion
addresses significant captions in the consolidated statement. Within the following discussions, however, we distinguish between GE
and GE Capital activities in order to permit meaningful analysis of each individual consolidating statement.
MAJOR CHANGES IN OUR FINANCIAL POSITION DURING 2015
x Cash and equivalents increased $0.5 billion. GE Cash and equivalents decreased $5.5 billion due to cash flows from operating
activities of $16.4 billion, more than offset by $10.4 billion used to acquire businesses (primarily Alstom) and $12.1 billion cash
returned to investors in the form of dividends of $9.3 billion and buyback of treasury stock of $2.8 billion (cash basis). GE Capital
Cash and equivalents increased $6.0 billion primarily driven by $79.6 billion in proceeds from business dispositions, partially offset
by $59.3 billion net repayment of debt and $4.6 billion in payments of dividends to shareowners. See the Statement of Cash Flows
section for additional information.
x Goodwill increased $12.3 billion, primarily as a result of the Alstom and Milestone acquisitions, partially offset by currency
exchange effects of the stronger U.S. dollar and disposals.
x All other assets increased $12.6 billion, primarily due to purchases of time deposits at GE Capital of $10.4 billion.
x Assets of discontinued operations decreased $202.6 billion, primarily due to the disposition of Consumer businesses of $113.8
billion (including the Synchrony Financial split-off), CLL businesses of $56.1 billion and Real Estate of $33.0 billion. See Note 2 for
additional information.
x Other GE current liabilities increased $9.3 billion, primarily driven by the Alstom acquisition of $5.6 billion and taxes payable of
$2.7 billion.
x Borrowings decreased $63.1 billion, primarily due to net repayments on GE Capital borrowings of $55.3 billion, along with an
$8.9 billion reduction in the balances driven by the strengthening of the U.S. dollar against major currencies, partially offset by a net
increase in borrowings by GE of $2.0 billion.
x Liabilities of discontinued operations decreased $81.7 billion, primarily driven by the disposition of Consumer businesses of
$69.1 billion (including the Synchrony Financial split-off), CLL businesses of $11.6 billion and Real Estate of $1.7 billion. See Note
2 for additional information.
x Retained earnings decreased $15.3 billion, due to common stock dividends of $9.1 billion in addition to a net loss of $6.1 billion.
x Common stock held in treasury increased $20.9 billion, primarily due to the Synchrony Financial share exchange of $20.4
billion and buyback of treasury stock of $3.3 billion (book basis). This was partially offset by treasury stock dispositions of $2.8
billion, primarily stock option exercises of $1.8 billion.
x Noncontrolling interests decreased $6.8 billion, primarily due to the GE Capital preferred share exchange of $4.9 billion and the
Synchrony Financial split-off of $2.8 billion, partially offset by noncontrolling interests related to the Alstom acquisition of $0.7
billion. The impact of the preferred share exchange is also the primary driver for the increase in Other capital of $4.7 billion. See
Note 15 for additional information.
78 GE 2015 FORM 10-K