GE 2015 Annual Report Download - page 210
Download and view the complete annual report
Please find page 210 of the 2015 GE annual report below. You can navigate through the pages in the report by either clicking on the pages listed below, or by using the keyword search tool below to find specific information within the annual report.-
 1
1 -
2
-
3
-
4
-
5
-
6
-
7
-
8
-
9
-
10
-
11
-
12
-
13
-
14
-
15
-
16
-
17
-
18
-
19
-
20
-
21
-
22
-
23
-
24
-
25
-
26
-
27
-
28
-
29
-
30
-
31
-
32
-
33
-
34
-
35
-
36
-
37
-
38
-
39
-
40
-
41
-
42
-
43
-
44
-
45
-
46
-
47
-
48
-
49
-
50
-
51
-
52
-
53
-
54
-
55
-
56
-
57
-
58
-
59
-
60
-
61
-
62
-
63
-
64
-
65
-
66
-
67
-
68
-
69
-
70
-
71
-
72
-
73
-
74
-
75
-
76
-
77
-
78
-
79
-
80
-
81
-
82
-
83
-
84
-
85
-
86
-
87
-
88
-
89
-
90
-
91
-
92
-
93
-
94
-
95
-
96
-
97
-
98
-
99
-
100
-
101
-
102
-
103
-
104
-
105
-
106
-
107
-
108
-
109
-
110
-
111
-
112
-
113
-
114
-
115
-
116
-
117
-
118
-
119
-
120
-
121
-
122
-
123
-
124
-
125
-
126
-
127
-
128
-
129
-
130
-
131
-
132
-
133
-
134
-
135
-
136
-
137
-
138
-
139
-
140
-
141
-
142
-
143
-
144
-
145
-
146
-
147
-
148
-
149
-
150
-
151
-
152
-
153
-
154
-
155
-
156
-
157
-
158
-
159
-
160
-
161
-
162
-
163
-
164
-
165
-
166
-
167
-
168
-
169
-
170
-
171
-
172
-
173
-
174
-
175
-
176
-
177
-
178
-
179
-
180
-
181
-
182
-
183
-
184
-
185
-
186
-
187
-
188
-
189
-
190
-
191
-
192
-
193
-
194
-
195
-
196
-
197
-
198
-
199
-
 200
200 -
 201
201 -
 202
202 -
 203
203 -
 204
204 -
 205
205 -
 206
206 -
 207
207 -
 208
208 -
 209
209 -
 210
210 -
 211
211 -
 212
212 -
 213
213 -
 214
214 -
 215
215 -
 216
216 -
 217
217 -
 218
218 -
 219
219 -
 220
220 -
221
-
222
-
223
-
224
-
225
-
226
-
227
-
228
-
229
-
230
-
231
-
232
-
233
-
234
-
235
-
236
-
237
-
238
-
239
-
240
-
241
-
242
-
243
-
244
-
245
-
246
-
247
-
248
-
249
-
250
-
251
-
252
 |
 |

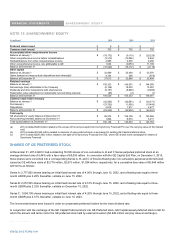
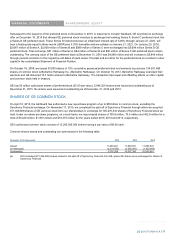
FINANCIAL STATEMENTS OTHER STOCK-RELATED INFORMATION
182 GE 2015 FORM 10-K
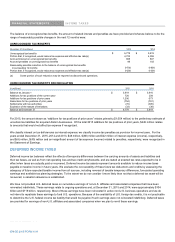
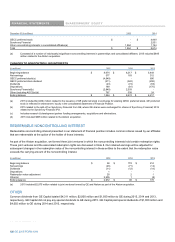
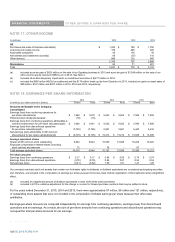
The table below shows the amount and weighted average strike price of options granted during 2015, as well as those outstanding and
exercisable at year-end 2015.
A
s of December 31, 2015 unless, otherwise stated
(
in thousands, except per share data
)
Stock options granted during 2015 52,561
Weighted average strike price of awards granted in 2015 $ 25.79
Stock options outstanding 467,922
Weighted average strike price of stock options outstanding $ 21.72
Stock options exercisable 298,199
Weighted average strike price of stock options exercisable $ 20.14
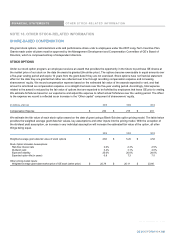
When an employee exercises an option, we issue treasury shares to satisfy the requirements of the option.
2015 201
4
2013
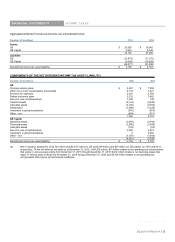
Stock options exercised (in thousands) 65,764 30,433 36,191
Cash received from stock options exercised (in millions) $ 1,098 $ 439 $ 490
Outstanding stock option awards may be dilutive to earnings per share when they are in the money (the market price of GE stock is
greater than the strike price of the option). When an option is dilutive, it increases the number of shares used in the diluted earnings per
share calculation, which will decrease earnings per share. However, the effect stock options have on the number of shares added to the
diluted earnings per share calculation is not one for one. The average amount of unrecognized compensation expense (the portion of
the fair value of these option awards not yet amortized), potential option-related excess tax benefits and the market price of GE stock
during the reporting period affect how many of these potential shares are included in the calculation. The calculation assumes that the
proceeds received from the exercise, the unrecognized compensation expense and any potential excess tax benefits are used to buy
back shares, which reduces the dilutive impact.
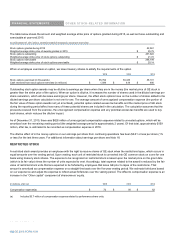
As of December 31, 2015, there was $628 million of unrecognized compensation expense related to unvested options, which will be
amortized over the remaining vesting period (the weighted average period is approximately 2 years). Of that total, approximately $159
million, after tax, is estimated to be recorded as compensation expense in 2016.
The dilutive effect of in the money options on our earnings per share from continuing operations has been $0.01 or less per share (1%
or less) for the last three years. For additional information about earnings per share see Note 18.
RESTRICTED STOCK
A restricted stock award provides an employee with the right to receive shares of GE stock when the restrictions lapse, which occurs in
equal amounts over the vesting period. Upon vesting, each unit of restricted stock is converted into GE common stock on a one for one
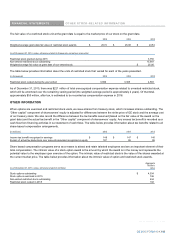
basis using treasury stock shares. The expense to be recognized on restricted stock is based upon the market price on the grant date
(which is its fair value) times the number of units expected to vest. Accordingly, total expense related to the award is reduced by the fair
value of restricted stock units that are expected to be forfeited by employees that leave GE prior to lapse of the restrictions. That
amount is amortized as compensation expense on a straight-line basis over the five-year vesting period. We estimate forfeitures based
on our experience and adjust the expense to reflect actual forfeitures over the vesting period. The offset to compensation expense is an
increase in the ³2WKHU FDSLWDO´ component of VKDUHRZQHUV¶ equity.
(In millions, after tax) 2015 201
4
2013
Compensation expense(a) $ 72 $ 56 $ 62
(a) Includes $5.7 million of compensation expense related to performance share units.
182 GE 2015 FORM 10-K