GE 2015 Annual Report Download - page 213
Download and view the complete annual report
Please find page 213 of the 2015 GE annual report below. You can navigate through the pages in the report by either clicking on the pages listed below, or by using the keyword search tool below to find specific information within the annual report.-
 1
1 -
2
-
3
-
4
-
5
-
6
-
7
-
8
-
9
-
10
-
11
-
12
-
13
-
14
-
15
-
16
-
17
-
18
-
19
-
20
-
21
-
22
-
23
-
24
-
25
-
26
-
27
-
28
-
29
-
30
-
31
-
32
-
33
-
34
-
35
-
36
-
37
-
38
-
39
-
40
-
41
-
42
-
43
-
44
-
45
-
46
-
47
-
48
-
49
-
50
-
51
-
52
-
53
-
54
-
55
-
56
-
57
-
58
-
59
-
60
-
61
-
62
-
63
-
64
-
65
-
66
-
67
-
68
-
69
-
70
-
71
-
72
-
73
-
74
-
75
-
76
-
77
-
78
-
79
-
80
-
81
-
82
-
83
-
84
-
85
-
86
-
87
-
88
-
89
-
90
-
91
-
92
-
93
-
94
-
95
-
96
-
97
-
98
-
99
-
100
-
101
-
102
-
103
-
104
-
105
-
106
-
107
-
108
-
109
-
110
-
111
-
112
-
113
-
114
-
115
-
116
-
117
-
118
-
119
-
120
-
121
-
122
-
123
-
124
-
125
-
126
-
127
-
128
-
129
-
130
-
131
-
132
-
133
-
134
-
135
-
136
-
137
-
138
-
139
-
140
-
141
-
142
-
143
-
144
-
145
-
146
-
147
-
148
-
149
-
150
-
151
-
152
-
153
-
154
-
155
-
156
-
157
-
158
-
159
-
160
-
161
-
162
-
163
-
164
-
165
-
166
-
167
-
168
-
169
-
170
-
171
-
172
-
173
-
174
-
175
-
176
-
177
-
178
-
179
-
180
-
181
-
182
-
183
-
184
-
185
-
186
-
187
-
188
-
189
-
190
-
191
-
192
-
193
-
194
-
195
-
196
-
197
-
198
-
199
-
200
-
201
-
202
-
 203
203 -
 204
204 -
 205
205 -
 206
206 -
 207
207 -
 208
208 -
 209
209 -
 210
210 -
 211
211 -
 212
212 -
 213
213 -
 214
214 -
 215
215 -
 216
216 -
 217
217 -
 218
218 -
 219
219 -
 220
220 -
 221
221 -
 222
222 -
 223
223 -
224
-
225
-
226
-
227
-
228
-
229
-
230
-
231
-
232
-
233
-
234
-
235
-
236
-
237
-
238
-
239
-
240
-
241
-
242
-
243
-
244
-
245
-
246
-
247
-
248
-
249
-
250
-
251
-
252
 |
 |

FINANCIAL STATEMENTS FAIR VALUE MEASUREMENTS
GE 2015 FORM 10-K 185
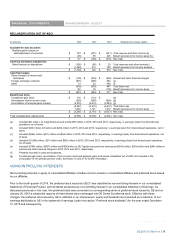
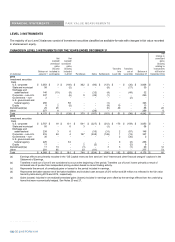
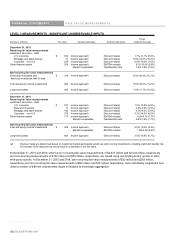
NOTE 19. FAIR VALUE MEASUREMENTS
RECURRING FAIR VALUE MEASUREMENTS
Our assets and liabilities measured at fair value on a recurring basis include investment securities primarily supporting obligations to
annuitants and policyholders in our run-off insurance operations and derivatives.
ASSETS AND LIABILITIES MEASURED AT FAIR VALUE ON A RECURRING BASIS
Nettin
g
(
In millions
)
Level 1
(
a
)
Level 2
(
a
)
Level 3 ad
j
ustment
(
b
)
Net balance
December 31, 2015
Assets
Investment securities
Debt
U.S. corporate $ - $ 19,351 $ 3,006 $ - $ 22,358
State and municipal - 4,215 30 - 4,245
Mortgage and asset-backed - 3,084 32 - 3,116
Corporate ± non-U.S. 12 544 290 - 847
Government ± non-U.S. 5 410 - - 415
U.S. government and federal agency 49 404 323 - 776
Equity 194 9 13 - 216
Derivatives(c) - 7,312 79 (6,110) 1,281
Other(d) - - 259 - 259
Total $ 260 $ 35,331 $ 4,033 $ (6,110) $ 33,512
Liabilities
Derivatives $ - $ 5,677 $ 4 $ (4,968) $ 713
Other(e) - 1,182 - - 1,182
Total $ - $ 6,860 $ 4 $ (4,968) $ 1,895
December 31, 2014
Assets
Investment securities
Debt
U.S. corporate $ - $ 20,651 $ 3,053 $ - $ 23,704
State and municipal - 4,560 58 - 4,618
Mortgage and asset-backed - 4,632 146 - 4,777
Corporate ± non-U.S. - 615 337 - 953
Government ± non-U.S. - 489 2 - 491
U.S. government and federal agency - 496 266 - 761
Equity 176 16 9 - 201
Derivatives(c) - 9,881 30 (7,570) 2,341
Other(d) - - 277 - 277
Total $ 176 $ 41,340 $ 4,177 $ (7,570) $ 38,122
Liabilities
Derivatives $ - $ 4,840 $ 11 $ (4,337) $ 514
Other(e) - 1,179 - - 1,179
Total $ - $ 6,018 $ 11 $ (4,337) $ 1,692
(a) There were no securities transferred between Level 1 and Level 2 for the years ended December 31, 2015 and 2014.
(b) The netting of derivative receivables and payables (including the effects of any collateral posted or received) is permitted when a legally
enforceable master netting agreement exists.
(c) The fair value of derivatives includes an adjustment for non-performance risk. At December 31, 2015 and 2014, the cumulative adjustment for
non-performance risk was insignificant and $16 million, respectively. See Notes 20 and 27 for additional information on the composition of our
derivative portfolio.
(d) Includes private equity investments.
(e) Primarily represented the liability associated with certain of our deferred incentive compensation plans.
GE 2015 FORM 10-K 185