GE 2015 Annual Report Download - page 186
Download and view the complete annual report
Please find page 186 of the 2015 GE annual report below. You can navigate through the pages in the report by either clicking on the pages listed below, or by using the keyword search tool below to find specific information within the annual report.-
 1
1 -
2
-
3
-
4
-
5
-
6
-
7
-
8
-
9
-
10
-
11
-
12
-
13
-
14
-
15
-
16
-
17
-
18
-
19
-
20
-
21
-
22
-
23
-
24
-
25
-
26
-
27
-
28
-
29
-
30
-
31
-
32
-
33
-
34
-
35
-
36
-
37
-
38
-
39
-
40
-
41
-
42
-
43
-
44
-
45
-
46
-
47
-
48
-
49
-
50
-
51
-
52
-
53
-
54
-
55
-
56
-
57
-
58
-
59
-
60
-
61
-
62
-
63
-
64
-
65
-
66
-
67
-
68
-
69
-
70
-
71
-
72
-
73
-
74
-
75
-
76
-
77
-
78
-
79
-
80
-
81
-
82
-
83
-
84
-
85
-
86
-
87
-
88
-
89
-
90
-
91
-
92
-
93
-
94
-
95
-
96
-
97
-
98
-
99
-
100
-
101
-
102
-
103
-
104
-
105
-
106
-
107
-
108
-
109
-
110
-
111
-
112
-
113
-
114
-
115
-
116
-
117
-
118
-
119
-
120
-
121
-
122
-
123
-
124
-
125
-
126
-
127
-
128
-
129
-
130
-
131
-
132
-
133
-
134
-
135
-
136
-
137
-
138
-
139
-
140
-
141
-
142
-
143
-
144
-
145
-
146
-
147
-
148
-
149
-
150
-
151
-
152
-
153
-
154
-
155
-
156
-
157
-
158
-
159
-
160
-
161
-
162
-
163
-
164
-
165
-
166
-
167
-
168
-
169
-
170
-
171
-
172
-
173
-
174
-
175
-
 176
176 -
 177
177 -
 178
178 -
 179
179 -
 180
180 -
 181
181 -
 182
182 -
 183
183 -
 184
184 -
 185
185 -
 186
186 -
 187
187 -
 188
188 -
 189
189 -
 190
190 -
 191
191 -
 192
192 -
 193
193 -
 194
194 -
 195
195 -
 196
196 -
197
-
198
-
199
-
200
-
201
-
202
-
203
-
204
-
205
-
206
-
207
-
208
-
209
-
210
-
211
-
212
-
213
-
214
-
215
-
216
-
217
-
218
-
219
-
220
-
221
-
222
-
223
-
224
-
225
-
226
-
227
-
228
-
229
-
230
-
231
-
232
-
233
-
234
-
235
-
236
-
237
-
238
-
239
-
240
-
241
-
242
-
243
-
244
-
245
-
246
-
247
-
248
-
249
-
250
-
251
-
252
 |
 |

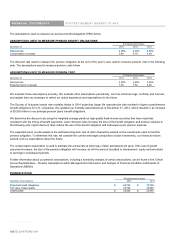
FINANCIAL STATEMENTS PROPERTY, PLANT AND EQUIPMENT
158 GE 2015 FORM 10-K
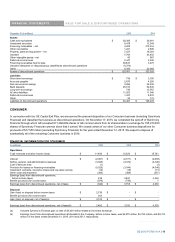
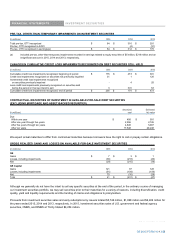
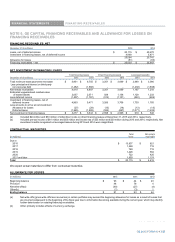
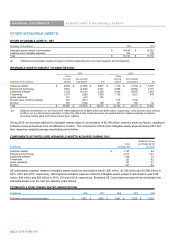
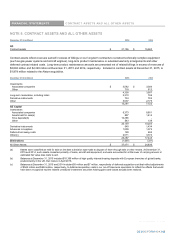
We manage our financing receivable portfolios using delinquency and nonaccrual data as key performance indicators. Substantially all
of our financing receivables are secured at December 31, 2015 and 2014.
At December 31, 2015, $622 million (2.5%), $201 million (0.8%) and $256 million (1.0%) of financing receivables were over 30 days
past due, over 90 days past due and on nonaccrual, respectively. At December 31, 2014, $610 million (2.4%), $131 million (0.5%) and
$512 million (2.0%) of financing receivables were over 30 days past due, over 90 days past due and on nonaccrual, respectively. The
vast majority of nonaccrual loans at December 31, 2015 and 2014, which are primarily at GECAS, are currently paying in accordance
with their contractual terms.
The recorded investment in impaired loans at December 31, 2015 and 2014 was $175 million and $412 million, respectively, primarily in
GECAS, and included $2 million and $20 million of impaired loans with specific allowances of $1 and $16 million, respectively, primarily
at EFS. The method used to measure impairment for these loans is primarily based on collateral value. At December 31, 2015, troubled
debt restructurings included in impaired loans were $116 million, the vast majority at GECAS.
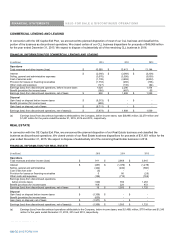
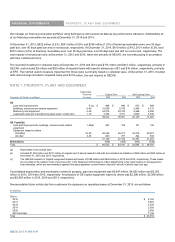
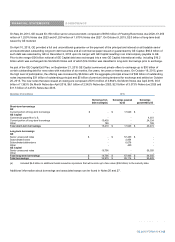
NOTE 7. PROPERTY, PLANT AND EQUIPMENT
Depreciable
lives-ne
w
Original Cost Net Carrying Value
December 31 (Dollars in millions) (in years) 2015 2014 2015 201
4
GE
Land and improvements 8 (a) $ 888 $ 690 $ 870 $ 698
Buildings, structures and related equipment 8-40 10,050 8,740 5,440 4,131
Machinery and equipment 4-20 24,515 23,370 9,986 9,040
Leasehold costs and manufacturing plant under construction 1-10 4,359 3,751 3,849 3,338
39,812 36,551 20,145 17,207
GE Capital(b)
Land and improvements, buildings, structures and related
equipment
1-35(a) 267 318 101 142
Equipment leased to others
Aircraft(c) 15-20 50,339 46,017 34,316 30,573
All other 3-35 543 767 364 539
51,149 47,102 34,781 31,253
Eliminations (939) (462) (831) (390)
Total $ 90,022 $ 83,191 $ 54,095 $ 48,070
(a) Depreciable lives exclude land.
(b) Included $1,024 million and $731 million of original cost of assets leased to GE with accumulated amortization of $83 million and $60 million at
December 31, 2015 and 2014, respectively.
(c) The GECAS business of Capital recognized impairment losses of $168 million and $445 million in 2015 and 2014, respectively. These losses
are recorded in the caption ³Cost of services sold´ in the Statement of Earnings to reflect adjustments to fair value based on PDQDJHPHQW¶V
best estimates, which are benchmarked against third-party appraiser current market values for aircraft of similar type and age.
Consolidated depreciation and amortization related to property, plant and equipment was $4,847 million, $4,953 million and $5,202
million in 2015, 2014 and 2013, respectively. Amortization of GE Capital equipment leased to others was $2,266 million, $2,386 million
and $2,693 million in 2015, 2014 and 2013, respectively.
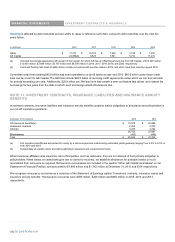
Noncancellable future rentals due from customers for equipment on operating leases at December 31, 2015, are as follows:
(In millions)
Due in
2016 $ 4,162
2017 3,876
2018 3,378
2019 2,920
2020 2,455
2021 and later 7,128
Total $ 23,919
158 GE 2015 FORM 10-K