GE 2015 Annual Report Download - page 239
Download and view the complete annual report
Please find page 239 of the 2015 GE annual report below. You can navigate through the pages in the report by either clicking on the pages listed below, or by using the keyword search tool below to find specific information within the annual report.-
 1
1 -
2
-
3
-
4
-
5
-
6
-
7
-
8
-
9
-
10
-
11
-
12
-
13
-
14
-
15
-
16
-
17
-
18
-
19
-
20
-
21
-
22
-
23
-
24
-
25
-
26
-
27
-
28
-
29
-
30
-
31
-
32
-
33
-
34
-
35
-
36
-
37
-
38
-
39
-
40
-
41
-
42
-
43
-
44
-
45
-
46
-
47
-
48
-
49
-
50
-
51
-
52
-
53
-
54
-
55
-
56
-
57
-
58
-
59
-
60
-
61
-
62
-
63
-
64
-
65
-
66
-
67
-
68
-
69
-
70
-
71
-
72
-
73
-
74
-
75
-
76
-
77
-
78
-
79
-
80
-
81
-
82
-
83
-
84
-
85
-
86
-
87
-
88
-
89
-
90
-
91
-
92
-
93
-
94
-
95
-
96
-
97
-
98
-
99
-
100
-
101
-
102
-
103
-
104
-
105
-
106
-
107
-
108
-
109
-
110
-
111
-
112
-
113
-
114
-
115
-
116
-
117
-
118
-
119
-
120
-
121
-
122
-
123
-
124
-
125
-
126
-
127
-
128
-
129
-
130
-
131
-
132
-
133
-
134
-
135
-
136
-
137
-
138
-
139
-
140
-
141
-
142
-
143
-
144
-
145
-
146
-
147
-
148
-
149
-
150
-
151
-
152
-
153
-
154
-
155
-
156
-
157
-
158
-
159
-
160
-
161
-
162
-
163
-
164
-
165
-
166
-
167
-
168
-
169
-
170
-
171
-
172
-
173
-
174
-
175
-
176
-
177
-
178
-
179
-
180
-
181
-
182
-
183
-
184
-
185
-
186
-
187
-
188
-
189
-
190
-
191
-
192
-
193
-
194
-
195
-
196
-
197
-
198
-
199
-
200
-
201
-
202
-
203
-
204
-
205
-
206
-
207
-
208
-
209
-
210
-
211
-
212
-
213
-
214
-
215
-
216
-
217
-
218
-
219
-
220
-
221
-
222
-
223
-
224
-
225
-
226
-
227
-
228
-
 229
229 -
 230
230 -
 231
231 -
 232
232 -
 233
233 -
 234
234 -
 235
235 -
 236
236 -
 237
237 -
 238
238 -
 239
239 -
 240
240 -
 241
241 -
 242
242 -
 243
243 -
 244
244 -
 245
245 -
 246
246 -
 247
247 -
 248
248 -
 249
249 -
250
-
251
-
252
 |
 |

FINANCIAL STATEMENTS QUARTERLY INFORMATION
GE 2015 FORM 10-K 211
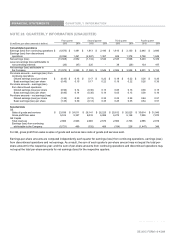
NOTE 28. QUARTERLY INFORMATION (UNAUDITED)
First quarter Second quarter Third quarter Fourth quarter
(In millions; per-share amounts in dollars) 2015 2014 2015 2014 2015 2014 2015 2014
Consolidated operations
Earnings (loss) from continuing operations $ (4,673) $ 1,491 $ 1,813 $ 2,180 $ 1,915 $ 2,130 $ 2,645 $ 3,690
Earnings (loss) from discontinued
operations (8,936) 1,461 (2,947) 1,367 629 1,378 3,758 1,649
Net earnings (loss) (13,608) 2,952 (1,134) 3,546 2,545 3,508 6,403 5,339
Less net earnings (loss) attributable to
noncontrolling interests (35) (47) 225 - 39 (29) 103 187
Net earnings (loss) attributable to
the Company $ (13,573) $ 2,999 $ (1,360) $ 3,546 $ 2,506 $ 3,536 $ 6,301 $ 5,152
Per-share amounts ± earnin
g
s
(
loss
)
from
continuing operations
Diluted earnings (loss) per share $ (0.45) $ 0.15 $ 0.17 $ 0.22 $ 0.19 $ 0.22 $ 0.26 $ 0.35
Basic earnings (loss) per share (0.45) 0.15 0.17 0.22 0.19 0.22 0.26 0.36
Per-share amounts ± earnings (loss)
from discontinued operations
Diluted earnings (loss) per share (0.90) 0.14 (0.30) 0.13 0.05 0.13 0.38 0.15
Basic earnings (loss) per share (0.90) 0.14 (0.30) 0.14 0.05 0.13 0.38 0.16
Per-share amounts ± net earnings (loss)
Diluted earnings (loss) per share (1.35) 0.30 (0.13) 0.35 0.25 0.35 0.64 0.51
Basic earnings (loss) per share (1.35) 0.30 (0.13) 0.35 0.25 0.35 0.64 0.51
Selected data
GE
Sales of goods and services $ 23,839 $ 24,011 $ 26,141 $ 26,225 $ 25,612 $ 26,025 $ 30,614 $ 31,046
Gross profit from sales 5,514 5,327 6,033 6,089 6,275 6,146 7,556 7,870
GE Capital
Total revenues 2,866 2,963 2,690 2,676 2,660 2,763 2,585 2,919
Earnings (loss) from continuing
attributable to the Company (5,721) 489 (332) 468 (154) 226 (1,447) 348
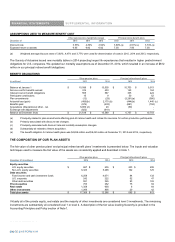
For GE, gross profit from sales is sales of goods and services less costs of goods and services sold.
Earnings-per-share amounts are computed independently each quarter for earnings (loss) from continuing operations, earnings (loss)
from discontinued operations and net earnings. As a result, the sum of each TXDUWHU¶V per-share amount may not equal the total per-
share amount for the respective year; and the sum of per-share amounts from continuing operations and discontinued operations may
not equal the total per-share amounts for net earnings (loss) for the respective quarters.
GE 2015 FORM 10-K 211