GE 2015 Annual Report Download - page 176
Download and view the complete annual report
Please find page 176 of the 2015 GE annual report below. You can navigate through the pages in the report by either clicking on the pages listed below, or by using the keyword search tool below to find specific information within the annual report.-
 1
1 -
2
-
3
-
4
-
5
-
6
-
7
-
8
-
9
-
10
-
11
-
12
-
13
-
14
-
15
-
16
-
17
-
18
-
19
-
20
-
21
-
22
-
23
-
24
-
25
-
26
-
27
-
28
-
29
-
30
-
31
-
32
-
33
-
34
-
35
-
36
-
37
-
38
-
39
-
40
-
41
-
42
-
43
-
44
-
45
-
46
-
47
-
48
-
49
-
50
-
51
-
52
-
53
-
54
-
55
-
56
-
57
-
58
-
59
-
60
-
61
-
62
-
63
-
64
-
65
-
66
-
67
-
68
-
69
-
70
-
71
-
72
-
73
-
74
-
75
-
76
-
77
-
78
-
79
-
80
-
81
-
82
-
83
-
84
-
85
-
86
-
87
-
88
-
89
-
90
-
91
-
92
-
93
-
94
-
95
-
96
-
97
-
98
-
99
-
100
-
101
-
102
-
103
-
104
-
105
-
106
-
107
-
108
-
109
-
110
-
111
-
112
-
113
-
114
-
115
-
116
-
117
-
118
-
119
-
120
-
121
-
122
-
123
-
124
-
125
-
126
-
127
-
128
-
129
-
130
-
131
-
132
-
133
-
134
-
135
-
136
-
137
-
138
-
139
-
140
-
141
-
142
-
143
-
144
-
145
-
146
-
147
-
148
-
149
-
150
-
151
-
152
-
153
-
154
-
155
-
156
-
157
-
158
-
159
-
160
-
161
-
162
-
163
-
164
-
165
-
 166
166 -
 167
167 -
 168
168 -
 169
169 -
 170
170 -
 171
171 -
 172
172 -
 173
173 -
 174
174 -
 175
175 -
 176
176 -
 177
177 -
 178
178 -
 179
179 -
 180
180 -
 181
181 -
 182
182 -
 183
183 -
 184
184 -
 185
185 -
 186
186 -
187
-
188
-
189
-
190
-
191
-
192
-
193
-
194
-
195
-
196
-
197
-
198
-
199
-
200
-
201
-
202
-
203
-
204
-
205
-
206
-
207
-
208
-
209
-
210
-
211
-
212
-
213
-
214
-
215
-
216
-
217
-
218
-
219
-
220
-
221
-
222
-
223
-
224
-
225
-
226
-
227
-
228
-
229
-
230
-
231
-
232
-
233
-
234
-
235
-
236
-
237
-
238
-
239
-
240
-
241
-
242
-
243
-
244
-
245
-
246
-
247
-
248
-
249
-
250
-
251
-
252
 |
 |

FINANCIAL STATEMENTS HELD FOR SALE & DISCONTINUED OPERATIONS
148 GE 2015 FORM 10-K
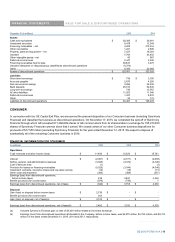
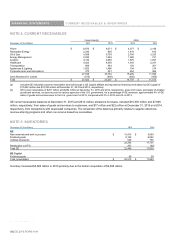
FINANCIAL INFORMATION FOR ASSETS AND LIABILITIES OF BUSINESSES HELD FOR SALE
December 31 (In millions) 2015 2014
Assets
Current receivables(a) $ 79 $ 180
Inventories 583 588
Property, plant, and equipment ± net 1,208 979
Goodwill 370 433
Other intangible assets ± net 162 157
Other 416 489
A
ssets of businesses held for sale $ 2,818 $ 2,826
Liabilities
A
ccounts payable(a) $ 503 $ 506
Other current liabilities 325 346
Other 33 89
Liabilities of businesses held for sale $ 861 $ 941
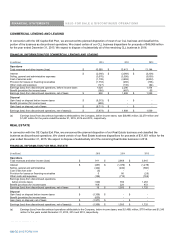
(a) Certain transactions at our Appliances and Signaling businesses are made on an arms-length basis with GE Capital, consisting primarily of
GE customer receivables sold to GE Capital and GE Capital services for material procurement. These intercompany balances included within
our held for sale businesses are reported in the GE and GE Capital columns of our financial statements, but are eliminated in deriving our
consolidated financial statements.
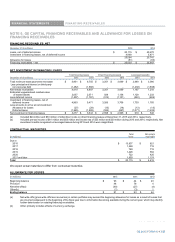
DISCONTINUED OPERATIONS
Discontinued operations primarily included our Consumer business, most of our CLL business, our Real Estate business, and our U.S.
mortgage business (WMC). Results of operations, financial position and cash flows for these businesses are separately reported as
discontinued operations for all periods presented.
We have entered into Transitional Service Agreements (TSA) with and provided certain indemnifications to buyers of GE &DSLWDO¶V
assets. Under the TSAs, GE Capital provides various services for terms generally between 12 and 24 months and receives a level of
cost reimbursement from the buyers.
Indemnifications amount to $1,543 million, for which we have recognized related liabilities of $62 million at December 31, 2015. In
addition, we provided $736 million of credit support, the vast majority on behalf of certain CLL customers aligned with signed disposal
transactions scheduled to close in 2016, and recognized an insignificant liability at December 31, 2015.
FINANCIAL INFORMATION FOR DISCONTINUED OPERATIONS
(In millions) 2015 2014 2013
Operations
Total revenues and other income (loss) $ 23,003 $ 31,136 $ 32,987
Earnings (loss) from discontinued operations before income taxes $ 887 $ 6,615 $ 6,558
Benefit (provision) for income taxes (791) (776) 699
Earnings (loss) from discontinued operations, net of taxes $ 96 $ 5,839 $ 7,257
Disposal
Gain (loss) on disposal before income taxes $ (6,612) $ 14 $ (2,027)
Benefit (provision) for income taxes (979) 1 246
Gain (loss) on disposal, net of taxes $ (7,591) $ 15 $ (1,781)
Earnings (loss) from discontinued operations, net of taxes(a)(b) $ (7,495) $ 5,855 $ 5,475
(a) The sum of GE industrial earnings (loss) from discontinued operations, net of taxes, and GE Capital earnings (loss) from discontinued
operations, net of taxes, after adjusting for earnings (loss) attributable to noncontrolling interests related to discontinued operations, is reported
within GE industrial earnings (loss) from discontinued operations, net of taxes, on the Consolidated Statement of Earnings (Loss).
(b) Earnings (loss) from discontinued operations attributable to the Company, before income taxes, was $(6,038) million, $6,472 million, and
$4,495 million for the years ended December 31, 2015, 2014, 2013, respectively.
148 GE 2015 FORM 10-K