GE 2015 Annual Report Download - page 230
Download and view the complete annual report
Please find page 230 of the 2015 GE annual report below. You can navigate through the pages in the report by either clicking on the pages listed below, or by using the keyword search tool below to find specific information within the annual report.-
 1
1 -
2
-
3
-
4
-
5
-
6
-
7
-
8
-
9
-
10
-
11
-
12
-
13
-
14
-
15
-
16
-
17
-
18
-
19
-
20
-
21
-
22
-
23
-
24
-
25
-
26
-
27
-
28
-
29
-
30
-
31
-
32
-
33
-
34
-
35
-
36
-
37
-
38
-
39
-
40
-
41
-
42
-
43
-
44
-
45
-
46
-
47
-
48
-
49
-
50
-
51
-
52
-
53
-
54
-
55
-
56
-
57
-
58
-
59
-
60
-
61
-
62
-
63
-
64
-
65
-
66
-
67
-
68
-
69
-
70
-
71
-
72
-
73
-
74
-
75
-
76
-
77
-
78
-
79
-
80
-
81
-
82
-
83
-
84
-
85
-
86
-
87
-
88
-
89
-
90
-
91
-
92
-
93
-
94
-
95
-
96
-
97
-
98
-
99
-
100
-
101
-
102
-
103
-
104
-
105
-
106
-
107
-
108
-
109
-
110
-
111
-
112
-
113
-
114
-
115
-
116
-
117
-
118
-
119
-
120
-
121
-
122
-
123
-
124
-
125
-
126
-
127
-
128
-
129
-
130
-
131
-
132
-
133
-
134
-
135
-
136
-
137
-
138
-
139
-
140
-
141
-
142
-
143
-
144
-
145
-
146
-
147
-
148
-
149
-
150
-
151
-
152
-
153
-
154
-
155
-
156
-
157
-
158
-
159
-
160
-
161
-
162
-
163
-
164
-
165
-
166
-
167
-
168
-
169
-
170
-
171
-
172
-
173
-
174
-
175
-
176
-
177
-
178
-
179
-
180
-
181
-
182
-
183
-
184
-
185
-
186
-
187
-
188
-
189
-
190
-
191
-
192
-
193
-
194
-
195
-
196
-
197
-
198
-
199
-
200
-
201
-
202
-
203
-
204
-
205
-
206
-
207
-
208
-
209
-
210
-
211
-
212
-
213
-
214
-
215
-
216
-
217
-
218
-
219
-
 220
220 -
 221
221 -
 222
222 -
 223
223 -
 224
224 -
 225
225 -
 226
226 -
 227
227 -
 228
228 -
 229
229 -
 230
230 -
 231
231 -
 232
232 -
 233
233 -
 234
234 -
 235
235 -
 236
236 -
 237
237 -
 238
238 -
 239
239 -
 240
240 -
241
-
242
-
243
-
244
-
245
-
246
-
247
-
248
-
249
-
250
-
251
-
252
 |
 |

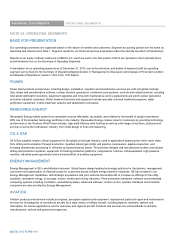
FINANCIAL STATEMENTS OPERATING SEGMENTS
202 GE 2015 FORM 10-K
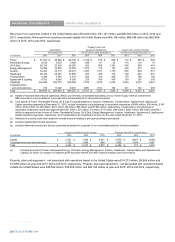
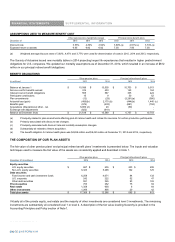
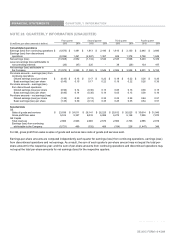
Revenues from customers located in the United States were $53,238 million, $51,147 million and $49,356 million in 2015, 2014 and
2013, respectively. Revenues from customers located outside the United States were $64,148 million, $66,038 million and $63,888
million in 2015, 2014 and 2013, respectively.
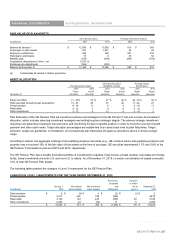
Property, plant and
Assets(a)(b) equipment additions(c) Depreciation and amortization
At December 31 For the years ended December 31 For the years ended December 31
(In millions) 2015 2014 2013 2015 2014 2013 2015 2014 2013
Power $ 51,674 $ 26,698 $ 26,168 $ 2,122 $ 578 $ 685 $ 712 $ 563 $ 593
Renewable Energy 8,726 3,572 3,269 999 41 23 116 113 73
Oil & Gas 26,126 27,329 26,250 422 656 1,191 596 585 481
Energy Management 16,808 10,976 10,305 1,073 176 137 322 313 323
A
viation 34,524 33,716 32,273 1,260 1,197 1,178 855 824 677
Healthcare 28,162 29,227 27,858 284 405 316 799 843 861
Transportation 4,368 4,449 4,418 202 128 282 179 169 166
A
ppliances & Lighting 4,702 4,560 4,306 275 359 405 103 235 300
Capital(d) 316,686 503,179 520,399 7,570 3,818 3,274 2,584 2,612 2,847
Corporate items
and eliminations(e) 916 11,249 8,001 (297) (111) 194 231 164 258
Total $ 492,692 $ 654,954 $ 663,247 $ 13,911 $ 7,247 $ 7,685 $ 6,499 $ 6,421 $ 6,581
(a) Assets of industrial discontinued operations, NBCU (our formerly consolidated subsidiary) and our former equity method investment in
NBCUniversal LLC are included in Corporate items and eliminations for all periods presented.
(b) Total assets of Power, Renewable Energy, Oil & Gas, Energy Management, Aviation, Healthcare, Transportation, Appliances & Lighting and
Capital operating segments at December 31, 2015, include investment in and advances to associated companies of $469 million, $36 million, $143
million, $743 million, $1,400 million, $571 million, $6 million, $59 million and $7,546 million, respectively. Investments in and advances to
associated companies contributed approximately $31 million, $(1) million, $7 million, $17 million, $88 million, $(43) million, $60 million and $347
million to segment pre-tax income of Power, Renewable Energy, Oil & Gas, Energy Management, Aviation, Healthcare, Appliances & Lighting and
Capital operating segments, respectively, and Transportation an insignificant amount, for the year ended December 31, 2015.
(c) Additions to property, plant and equipment include amounts relating to principal businesses purchased.
(d) Includes Capital discontinued operations
(e) Includes deferred income taxes that are presented as assets for purposes of our consolidating balance sheet presentation.
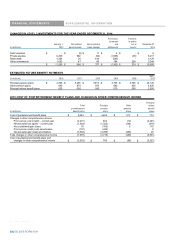
Interest and other financial charges Provision (benefit) for income taxes
(In millions) 2015
2014 2013 2015 2014 2013
Capital $ 2,301 $ 1,638 $ 2,021 $ 4,979 $ (861) $ (448)
Corporate items and eliminations(a) 1,162 1,085 849 1,506 1,634 1,667
Total $ 3,463 $ 2,723 $ 2,870 $ 6,485 $ 773 $ 1,219
(a) Included amounts for Power, Renewable Energy, Oil & Gas, Energy Management, Aviation, Healthcare, Transportation and Appliances &
Lighting, for which our measure of segment profit excludes interest and other financial charges and income taxes.
Property, plant and equipment ± net associated with operations based in the United States were $14,273 million, $9,868 million and
$10,065 million at year-end 2015, 2014 and 2013, respectively. Property, plant and equipment ± net associated with operations based
outside the United States were $39,822 million, $38,202 million and $40,165 million at year-end 2015, 2014 and 2013, respectively.
202 GE 2015 FORM 10-K