GE 2015 Annual Report Download - page 130
Download and view the complete annual report
Please find page 130 of the 2015 GE annual report below. You can navigate through the pages in the report by either clicking on the pages listed below, or by using the keyword search tool below to find specific information within the annual report.-
 1
1 -
2
-
3
-
4
-
5
-
6
-
7
-
8
-
9
-
10
-
11
-
12
-
13
-
14
-
15
-
16
-
17
-
18
-
19
-
20
-
21
-
22
-
23
-
24
-
25
-
26
-
27
-
28
-
29
-
30
-
31
-
32
-
33
-
34
-
35
-
36
-
37
-
38
-
39
-
40
-
41
-
42
-
43
-
44
-
45
-
46
-
47
-
48
-
49
-
50
-
51
-
52
-
53
-
54
-
55
-
56
-
57
-
58
-
59
-
60
-
61
-
62
-
63
-
64
-
65
-
66
-
67
-
68
-
69
-
70
-
71
-
72
-
73
-
74
-
75
-
76
-
77
-
78
-
79
-
80
-
81
-
82
-
83
-
84
-
85
-
86
-
87
-
88
-
89
-
90
-
91
-
92
-
93
-
94
-
95
-
96
-
97
-
98
-
99
-
100
-
101
-
102
-
103
-
104
-
105
-
106
-
107
-
108
-
109
-
110
-
111
-
112
-
113
-
114
-
115
-
116
-
117
-
118
-
119
-
 120
120 -
 121
121 -
 122
122 -
 123
123 -
 124
124 -
 125
125 -
 126
126 -
 127
127 -
 128
128 -
 129
129 -
 130
130 -
 131
131 -
 132
132 -
 133
133 -
 134
134 -
 135
135 -
 136
136 -
 137
137 -
 138
138 -
 139
139 -
 140
140 -
141
-
142
-
143
-
144
-
145
-
146
-
147
-
148
-
149
-
150
-
151
-
152
-
153
-
154
-
155
-
156
-
157
-
158
-
159
-
160
-
161
-
162
-
163
-
164
-
165
-
166
-
167
-
168
-
169
-
170
-
171
-
172
-
173
-
174
-
175
-
176
-
177
-
178
-
179
-
180
-
181
-
182
-
183
-
184
-
185
-
186
-
187
-
188
-
189
-
190
-
191
-
192
-
193
-
194
-
195
-
196
-
197
-
198
-
199
-
200
-
201
-
202
-
203
-
204
-
205
-
206
-
207
-
208
-
209
-
210
-
211
-
212
-
213
-
214
-
215
-
216
-
217
-
218
-
219
-
220
-
221
-
222
-
223
-
224
-
225
-
226
-
227
-
228
-
229
-
230
-
231
-
232
-
233
-
234
-
235
-
236
-
237
-
238
-
239
-
240
-
241
-
242
-
243
-
244
-
245
-
246
-
247
-
248
-
249
-
250
-
251
-
252
 |
 |

MD&A SUPPLEMENTAL INFORMATION
102 GE 2015 FORM 10-K
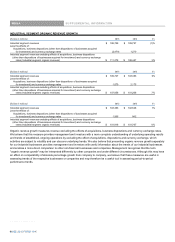
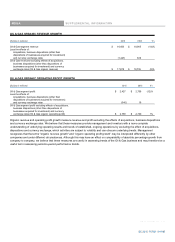
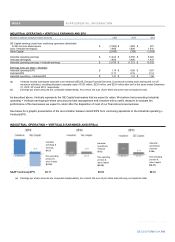
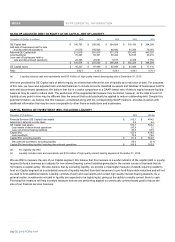
INDUSTRIAL OPERATING PROFIT AND OPERATING PROFIT MARGIN
(
EXCLUDING ALSTOM
)
(Dollars in millions) 2015 2014 2013 2012 2011
Revenues
Total industrial segment revenues $ 108,796 $ 109,727 $ 103,383 $ 102,548 $ 95,074
Corporate items and eliminations (2,211) (3,863) (1,405) (1,228) 3,145
Less: gains 1,497 91 1,981 1,801 5,686
Less: GE-GECC eliminations (1,786) (2,150) (1,922) (2,212) (2,086)
Adjusted corporate items and eliminations (1,922) (1,804) (1,464) (817) (455)
Total Industrial operating revenues 106,874 107,923 101,919 101,731 94,619
Less Alstom revenues 1,956 - - - -
Total Industrial operating
revenues excluding Alstom $ 104,918 $ 107,923 $ 101,919 $ 101,731 $ 94,619
Segment profit (loss)
Total industrial segment profit $ 17,966 $ 17,764 $ 16,220 $ 15,487 $ 14,067
Corporate items and eliminations
(
5,108
)
(
6,225
)
(
6,002
)
(
4,719
)
(
286
)
Less:
g
ains 1,497 91 1,975 1,801 4,535
Less: restructurin
g
and other char
g
es
(
1,734
)
(
1,788
)
(
1,992
)
(
732
)
(
1,068
)
Less: non-operatin
g
pension costs
(
pre-tax
)
(
2,764
)
(
2,120
)
(
2,624
)
(
2,132
)
(
1,057
)
Ad
j
usted cor
p
orate items and eliminations
(
2,107
)
(
2,408
)
(
3,361
)
(
3,656
)
(
2,696
)
Total Industrial o
p
eratin
g
p
rofit 15,859 15,356 12,859 11,831 11,371
Less Alstom profit (loss)(a) (154) - - - -
Total Industrial operating profit
excluding Alstom $ 16,013 $ 15,356 $ 12,859 $ 11,831 $ 11,371
Total Industrial operating profit margin
excluding Alstom 15.3% 14.2% 12.6% 11.6% 12.0%
(a) Loss from operations of the power and grid businesses of Alstom during the period of our ownership.
We have presented our Industrial operating profit and operating profit margin excluding restructuring, gains, and GE-GE Capital
eliminations as well as the results of our fourth quarter 2015 Alstom power and grid acquisition. We believe that Industrial operating
profit and operating profit margin adjusted for restructuring, gains and GE-GE Capital eliminations as well as the Alstom impacts are
meaningful measures because they increase the comparability of period-to-period results.
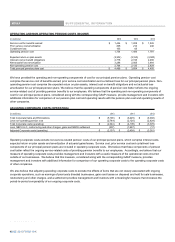
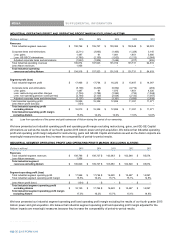
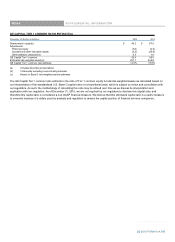
INDUSTRIAL SEGMENT OPERATING PROFIT AND OPERATING PROFIT MARGIN
(
EXCLUDING ALSTOM
)
(Dollars in millions) 2015 2014 2013 2012 2011
Revenues
Total industrial segment revenues $ 108,796 $ 109,727 $ 103,383 $ 102,548 $ 95,074
Less Alstom revenues 1,956 - - - -
Total industrial segment
revenues excluding Alstom $ 106,840 $ 109,727 $ 103,383 $ 102,548 $ 95,074
Segment operating profit (loss)
Total industrial segment operating profit $ 17,966 $ 17,764 $ 16,220 $ 15,487 $ 14,067
Total industrial segment operating profit margin 16.5% 16.2% 15.7% 15.1% 14.8%
Less Alstom profit (loss) $ (154) $ - $ - $ - $ -
Total industrial segment operating profit
excluding Alstom $ 18,120 $ 17,764 $ 16,220 $ 15,487 $ 14,067
Total industrial segment operating profit margin
excluding Alstom 17.0% 16.2% 15.7% 15.1% 14.8%
We have presented our industrial segment operating profit and operating profit margin excluding the results of our fourth quarter 2015
Alstom power and grid acquisition. We believe that industrial segment operating profit and operating profit margin adjusted for the
Alstom impacts are meaningful measures because they increase the comparability of period-to-period results.
102 GE 2015 FORM 10-K