GE 2015 Annual Report Download - page 185
Download and view the complete annual report
Please find page 185 of the 2015 GE annual report below. You can navigate through the pages in the report by either clicking on the pages listed below, or by using the keyword search tool below to find specific information within the annual report.-
 1
1 -
2
-
3
-
4
-
5
-
6
-
7
-
8
-
9
-
10
-
11
-
12
-
13
-
14
-
15
-
16
-
17
-
18
-
19
-
20
-
21
-
22
-
23
-
24
-
25
-
26
-
27
-
28
-
29
-
30
-
31
-
32
-
33
-
34
-
35
-
36
-
37
-
38
-
39
-
40
-
41
-
42
-
43
-
44
-
45
-
46
-
47
-
48
-
49
-
50
-
51
-
52
-
53
-
54
-
55
-
56
-
57
-
58
-
59
-
60
-
61
-
62
-
63
-
64
-
65
-
66
-
67
-
68
-
69
-
70
-
71
-
72
-
73
-
74
-
75
-
76
-
77
-
78
-
79
-
80
-
81
-
82
-
83
-
84
-
85
-
86
-
87
-
88
-
89
-
90
-
91
-
92
-
93
-
94
-
95
-
96
-
97
-
98
-
99
-
100
-
101
-
102
-
103
-
104
-
105
-
106
-
107
-
108
-
109
-
110
-
111
-
112
-
113
-
114
-
115
-
116
-
117
-
118
-
119
-
120
-
121
-
122
-
123
-
124
-
125
-
126
-
127
-
128
-
129
-
130
-
131
-
132
-
133
-
134
-
135
-
136
-
137
-
138
-
139
-
140
-
141
-
142
-
143
-
144
-
145
-
146
-
147
-
148
-
149
-
150
-
151
-
152
-
153
-
154
-
155
-
156
-
157
-
158
-
159
-
160
-
161
-
162
-
163
-
164
-
165
-
166
-
167
-
168
-
169
-
170
-
171
-
172
-
173
-
174
-
 175
175 -
 176
176 -
 177
177 -
 178
178 -
 179
179 -
 180
180 -
 181
181 -
 182
182 -
 183
183 -
 184
184 -
 185
185 -
 186
186 -
 187
187 -
 188
188 -
 189
189 -
 190
190 -
 191
191 -
 192
192 -
 193
193 -
 194
194 -
 195
195 -
196
-
197
-
198
-
199
-
200
-
201
-
202
-
203
-
204
-
205
-
206
-
207
-
208
-
209
-
210
-
211
-
212
-
213
-
214
-
215
-
216
-
217
-
218
-
219
-
220
-
221
-
222
-
223
-
224
-
225
-
226
-
227
-
228
-
229
-
230
-
231
-
232
-
233
-
234
-
235
-
236
-
237
-
238
-
239
-
240
-
241
-
242
-
243
-
244
-
245
-
246
-
247
-
248
-
249
-
250
-
251
-
252
 |
 |

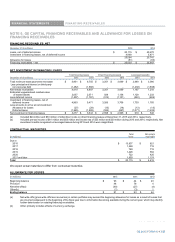
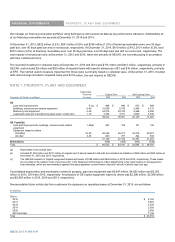
FINANCIAL STATEMENTS FINANCING RECEIVABLES
GE 2015 FORM 10-K 157
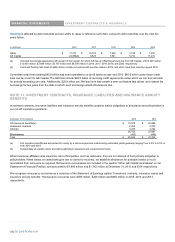
NOTE 6. GE CAPITAL FINANCING RECEIVABLES AND ALLOWANCE FOR LOSSES ON
FINANCING RECEIVABLES
FINANCING RECEIVABLES
,
NET
December 31
(
In millions
)
2015 2014
Loans, net of deferred income $ 20,115 $ 20,270
Investment in financin
g
leases, net of deferred income 4,969 5,471
25,084 25,741
A
llowance for losses
(
81
)
(
93
)
Financin
g
receivables ± net $ 25,003 $ 25,647
NET INVESTMENT IN FINANCING LEASES
Total financin
g
leases Direct financin
g
leases
(
a
)
Levera
g
ed leases
(
b
)
December 31
(
In millions
)
2015 2014 2015 2014 2015 2014
Total minimum lease pa
y
ments receivable $ 5,901 $ 6,755 $ 3,251 $ 3,669 $ 2,649 $ 3,086
Less principal and interest on third-part
y
non-recourse debt
(
1,482
)
(
1,868
)
- -
(
1,482
)
(
1,868
)
Net rentals receivables 4,419 4,887 3,251 3,669 1,167 1,218
Estimated un
g
uaranteed residual value
of leased assets 2,057 2,371 928 1,138 1,129 1,233
Less deferred income
(
1,507
)
(
1,787
)
(
913
)
(
1,101
)
(
593
)
(
686
)
Investment in financin
g
leases, net of
deferred income 4,969 5,471 3,266 3,706 1,703 1,765
Less amounts to arrive at net investment
Allowance for losses
(
27
)
(
29
)
(
15
)
(
14
)
(
13
)
(
15
)
Deferred taxes
(
1,665
)
(
1,899
)
(
593
)
(
697
)
(
1,071
)
(
1,202
)
Net investment in financin
g
leases $ 3,277 $ 3,543 $ 2,658 $ 2,995 $ 619 $ 548
(a) Included $24 million and $33 million of initial direct costs on direct financing leases at December 31, 2015 and 2014, respectively.
(b) Included pre-tax income of $61 million and $53 million and income tax of $23 million and $20 million during 2015 and 2014, respectively. Net
investment credits recognized on leveraged leases during 2015 and 2014 were insignificant.
CONTRACTUAL MATURITIES
Total Net rentals
(
In millions
)
loans receivable
Due in
2016 $ 13,937 $ 821
2017 1,299 719
2018 769 715
2019 1,428 564
2020 722 425
2021 and later 1,959 1,174
Total $ 20,115 $ 4,419
We expect actual maturities to differ from contractual maturities.
ALLOWANCE FOR LOSSES
(In millions) 2015 2014 2013
Beginning balance $ 93 $ 44 $ 43
Provision 48 79 4
Net write-offs(a) (60) (27) (4)
Other(b) (1) (3) 1
Ending balance $ 81 $ 93 $ 44
(a) Net write-offs (gross write-offs less recoveries) in certain portfolios may exceed the beginning allowance for losses as a result of losses that
are incurred subsequent to the beginning of the fiscal year due to information becoming available during the current year, which may identify
further deterioration on existing financing receivables.
(b) Other primarily includes effects of currency exchange.
GE 2015 FORM 10-K 157