GE 2015 Annual Report Download - page 182
Download and view the complete annual report
Please find page 182 of the 2015 GE annual report below. You can navigate through the pages in the report by either clicking on the pages listed below, or by using the keyword search tool below to find specific information within the annual report.-
 1
1 -
2
-
3
-
4
-
5
-
6
-
7
-
8
-
9
-
10
-
11
-
12
-
13
-
14
-
15
-
16
-
17
-
18
-
19
-
20
-
21
-
22
-
23
-
24
-
25
-
26
-
27
-
28
-
29
-
30
-
31
-
32
-
33
-
34
-
35
-
36
-
37
-
38
-
39
-
40
-
41
-
42
-
43
-
44
-
45
-
46
-
47
-
48
-
49
-
50
-
51
-
52
-
53
-
54
-
55
-
56
-
57
-
58
-
59
-
60
-
61
-
62
-
63
-
64
-
65
-
66
-
67
-
68
-
69
-
70
-
71
-
72
-
73
-
74
-
75
-
76
-
77
-
78
-
79
-
80
-
81
-
82
-
83
-
84
-
85
-
86
-
87
-
88
-
89
-
90
-
91
-
92
-
93
-
94
-
95
-
96
-
97
-
98
-
99
-
100
-
101
-
102
-
103
-
104
-
105
-
106
-
107
-
108
-
109
-
110
-
111
-
112
-
113
-
114
-
115
-
116
-
117
-
118
-
119
-
120
-
121
-
122
-
123
-
124
-
125
-
126
-
127
-
128
-
129
-
130
-
131
-
132
-
133
-
134
-
135
-
136
-
137
-
138
-
139
-
140
-
141
-
142
-
143
-
144
-
145
-
146
-
147
-
148
-
149
-
150
-
151
-
152
-
153
-
154
-
155
-
156
-
157
-
158
-
159
-
160
-
161
-
162
-
163
-
164
-
165
-
166
-
167
-
168
-
169
-
170
-
171
-
 172
172 -
 173
173 -
 174
174 -
 175
175 -
 176
176 -
 177
177 -
 178
178 -
 179
179 -
 180
180 -
 181
181 -
 182
182 -
 183
183 -
 184
184 -
 185
185 -
 186
186 -
 187
187 -
 188
188 -
 189
189 -
 190
190 -
 191
191 -
 192
192 -
193
-
194
-
195
-
196
-
197
-
198
-
199
-
200
-
201
-
202
-
203
-
204
-
205
-
206
-
207
-
208
-
209
-
210
-
211
-
212
-
213
-
214
-
215
-
216
-
217
-
218
-
219
-
220
-
221
-
222
-
223
-
224
-
225
-
226
-
227
-
228
-
229
-
230
-
231
-
232
-
233
-
234
-
235
-
236
-
237
-
238
-
239
-
240
-
241
-
242
-
243
-
244
-
245
-
246
-
247
-
248
-
249
-
250
-
251
-
252
 |
 |

FINANCIAL STATEMENTS INVESTMENT SECURITIES
154 GE 2015 FORM 10-K
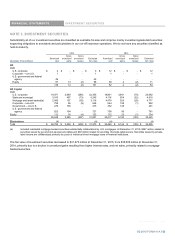
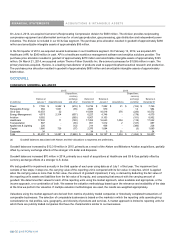
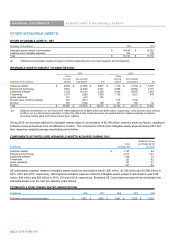
ESTIMATED FAIR VALUE AND GROSS UNREALIZED LOSSES OF AVAILABLE-FOR-SALE INVESTMENT SECURITIES
In loss position for
Less than 12 months 12 months or more
Gross Gross
Estimated unrealized Estimated unrealized
(In millions) fair value(a) losses(a)(b) fair value losses(b)
December 31, 2015
Debt
U.S. corporate
$
2,966
$
(218)
$
433
$
(67)
State and municipal 494 (20) 155 (53)
Mortgage and asset-backed 719 (20) 84 (16)
Corporate ± non-U.S. 56 (4) 14 (4)
Equity 36 (6) - -
Total
$
4,273
$
(269)
$
686
$
(140) (c)
December 31, 2014
Debt
U.S. corporate
$
556
$
(17)
$
836
$
(53)
State and municipal 67 (1) 274 (51)
Mortgage and asset-backed 174 (1) 307 (28)
Corporate ± non-U.S. 39 (1) - -
Equity 10 (3) - -
Total
$
846
$
(22)
$
1,417
$
(132)
(a) Includes the estimated fair value of and gross unrealized losses on equity securities held by GE. At December 31, 2015, the estimated fair
value of and gross unrealized losses on equity securities were $6 million and $(2) million, respectively. At December 31, 2014, the estimated
fair value of and gross unrealized losses on equity securities were $4 million and $(2) million, respectively.
(b) Included gross unrealized losses of $(1) million related to securities that had other-than-temporary impairments previously recognized at
December 31, 2015.
(c) Includes debt securities held to support obligations to holders of Guaranteed Investment Contracts (GICs) all of which are considered to be
investment-grade by the major rating agencies at December 31, 2015.
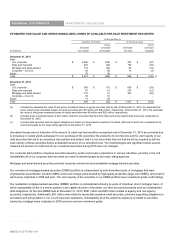
Unrealized losses are not indicative of the amount of credit loss that would be recognized and at December 31, 2015 are primarily due
to increases in market yields subsequent to our purchase of the securities. We presently do not intend to sell the vast majority of our
debt securities that are in an unrealized loss position and believe that it is not more likely than not that we will be required to sell the
vast majority of these securities before anticipated recovery of our amortized cost. The methodologies and significant inputs used to
measure the amount of credit loss for our investment securities during 2015 have not changed.
Our corporate debt portfolio comprises securities issued by public and private corporations in various industries, primarily in the U.S.
Substantially all of our corporate debt securities are rated investment grade by the major rating agencies.
Mortgage and asset-backed securities primarily comprise commercial and residential mortgage-backed securities.
Our commercial mortgage-backed securities (CMBS) portfolio is collateralized by both diversified pools of mortgages that were
originated for securitization (conduit CMBS) and pools of large loans backed by high-quality properties (large loan CMBS), about half of
which were originated in 2008 and prior. The vast majority of the securities in our CMBS portfolio have investment-grade credit ratings.
Our residential mortgage-backed securities (RMBS) portfolio is collateralized primarily by pools of individual, direct mortgage loans, of
which substantially all are in a senior position in the capital structure of the deals, not other structured products such as collateralized
debt obligations. Of the total RMBS held at December 31, 2015, $587 million and $30 million related to agency and non-agency
securities, respectively. Additionally, $57 million was related to residential subprime credit securities, primarily supporting obligations to
annuitants and policyholders in our run-off insurance operations. Substantially all of the subprime exposure is related to securities
backed by mortgage loans originated in 2005 and prior and are investment grade.
154 GE 2015 FORM 10-K