GE 2015 Annual Report Download - page 238
Download and view the complete annual report
Please find page 238 of the 2015 GE annual report below. You can navigate through the pages in the report by either clicking on the pages listed below, or by using the keyword search tool below to find specific information within the annual report.-
 1
1 -
2
-
3
-
4
-
5
-
6
-
7
-
8
-
9
-
10
-
11
-
12
-
13
-
14
-
15
-
16
-
17
-
18
-
19
-
20
-
21
-
22
-
23
-
24
-
25
-
26
-
27
-
28
-
29
-
30
-
31
-
32
-
33
-
34
-
35
-
36
-
37
-
38
-
39
-
40
-
41
-
42
-
43
-
44
-
45
-
46
-
47
-
48
-
49
-
50
-
51
-
52
-
53
-
54
-
55
-
56
-
57
-
58
-
59
-
60
-
61
-
62
-
63
-
64
-
65
-
66
-
67
-
68
-
69
-
70
-
71
-
72
-
73
-
74
-
75
-
76
-
77
-
78
-
79
-
80
-
81
-
82
-
83
-
84
-
85
-
86
-
87
-
88
-
89
-
90
-
91
-
92
-
93
-
94
-
95
-
96
-
97
-
98
-
99
-
100
-
101
-
102
-
103
-
104
-
105
-
106
-
107
-
108
-
109
-
110
-
111
-
112
-
113
-
114
-
115
-
116
-
117
-
118
-
119
-
120
-
121
-
122
-
123
-
124
-
125
-
126
-
127
-
128
-
129
-
130
-
131
-
132
-
133
-
134
-
135
-
136
-
137
-
138
-
139
-
140
-
141
-
142
-
143
-
144
-
145
-
146
-
147
-
148
-
149
-
150
-
151
-
152
-
153
-
154
-
155
-
156
-
157
-
158
-
159
-
160
-
161
-
162
-
163
-
164
-
165
-
166
-
167
-
168
-
169
-
170
-
171
-
172
-
173
-
174
-
175
-
176
-
177
-
178
-
179
-
180
-
181
-
182
-
183
-
184
-
185
-
186
-
187
-
188
-
189
-
190
-
191
-
192
-
193
-
194
-
195
-
196
-
197
-
198
-
199
-
200
-
201
-
202
-
203
-
204
-
205
-
206
-
207
-
208
-
209
-
210
-
211
-
212
-
213
-
214
-
215
-
216
-
217
-
218
-
219
-
220
-
221
-
222
-
223
-
224
-
225
-
226
-
227
-
 228
228 -
 229
229 -
 230
230 -
 231
231 -
 232
232 -
 233
233 -
 234
234 -
 235
235 -
 236
236 -
 237
237 -
 238
238 -
 239
239 -
 240
240 -
 241
241 -
 242
242 -
 243
243 -
 244
244 -
 245
245 -
 246
246 -
 247
247 -
 248
248 -
249
-
250
-
251
-
252
 |
 |

FINANCIAL STATEMENTS SUPPLEMENTAL INFORMATION
210 GE 2015 FORM 10-K
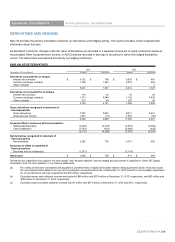
CASH FLOW HEDGE ACTIVITY
Gain (loss) reclassified
Gain (loss) recognized in AOCI from AOCI into earnings
(In millions) 2015 2014 2015 2014
Interest rate contracts $ (1) $ (1) $ (130) $ (234)
Currency exchange contracts (907) (541) (784) (641)
Commodity contracts (5) (4) (4) (3)
Total(a) $ (913) $ (546) $ (918) $ (878)
(a) Gain (loss) is recorded in GE Capital revenues from services, interest and other financial charges, and other costs and expenses when
reclassified to earnings.
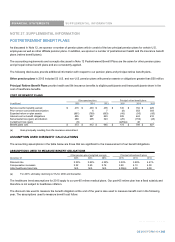
The total pre-tax amount in AOCI related to cash flow hedges of forecasted transactions was a $49 million loss at December 31, 2015.
We expect to transfer $134 million to earnings as an expense in the next 12 months contemporaneously with the earnings effects of the
related forecasted transactions. In both 2015 and 2014, we recognized insignificant gains and losses related to hedged forecasted
transactions and firm commitments that did not occur by the end of the originally specified period. At December 31, 2015 and 2014, the
maximum term of derivative instruments that hedge forecasted transactions was 17 years and 18 years, respectively. See Note15 for
additional information about reclassifications out of AOCI.
For cash flow hedges, the amount of ineffectiveness in the hedging relationship and amount of the changes in fair value of the
derivatives that are not included in the measurement of ineffectiveness were insignificant for each reporting period.
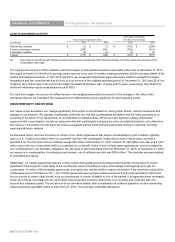
COUNTERPARTY CREDIT RISK
Fair values of our derivatives can change significantly from period to period based on, among other factors, market movements and
changes in our positions. We manage counterparty credit risk (the risk that counterparties will default and not make payments to us
according to the terms of our agreements) on an individual counterparty basis. Where we have agreed to netting of derivative
exposures with a counterparty, we net our exposures with that counterparty and apply the value of collateral posted to us to determine
the exposure. We actively monitor these net exposures against defined limits and take appropriate actions in response, including
requiring additional collateral.
As discussed above, we have provisions in certain of our master agreements that require counterparties to post collateral (typically,
cash or U.S. Treasury securities) when our receivable due from the counterparty, measured at current market value, exceeds a
specified limit. The fair value of such collateral was $3,061 million at December 31, 2015, of which $1,784 million was cash and $1,277
million was in the form of securities held by a custodian for our benefit. Under certain of these same agreements, we post collateral to
our counterparties for our derivative obligations, the fair value of which was $642 million at December 31, 2015. At December 31, 2015,
our exposure to counterparties (including accrued interest), net of collateral we hold, was $836 million. This excludes exposure related
to embedded derivatives.
Additionally, our master agreements typically contain mutual downgrade provisions that provide the ability of each party to require
termination if the long-term credit rating of the counterparty were to fall below A-/A3 or other ratings levels agreed upon with the
counterparty. In certain of these master agreements, each party also has the ability to require termination if the short-term rating of the
counterparty were to fall below A-1/P-1. Our master agreements also typically contain provisions that provide termination rights upon
the occurrence of certain other events, such as a bankruptcy or events of default by one of the parties. If an agreement was terminated
under any of these circumstances, the termination amount payable would be determined on a net basis and could also take into
account any collateral posted. The net amount of our derivative liability, after consideration of collateral posted by us and outstanding
interest payments was $690 million at December 31, 2015. This excludes embedded derivatives.
210 GE 2015 FORM 10-K