GE 2015 Annual Report Download - page 117
Download and view the complete annual report
Please find page 117 of the 2015 GE annual report below. You can navigate through the pages in the report by either clicking on the pages listed below, or by using the keyword search tool below to find specific information within the annual report.-
 1
1 -
2
-
3
-
4
-
5
-
6
-
7
-
8
-
9
-
10
-
11
-
12
-
13
-
14
-
15
-
16
-
17
-
18
-
19
-
20
-
21
-
22
-
23
-
24
-
25
-
26
-
27
-
28
-
29
-
30
-
31
-
32
-
33
-
34
-
35
-
36
-
37
-
38
-
39
-
40
-
41
-
42
-
43
-
44
-
45
-
46
-
47
-
48
-
49
-
50
-
51
-
52
-
53
-
54
-
55
-
56
-
57
-
58
-
59
-
60
-
61
-
62
-
63
-
64
-
65
-
66
-
67
-
68
-
69
-
70
-
71
-
72
-
73
-
74
-
75
-
76
-
77
-
78
-
79
-
80
-
81
-
82
-
83
-
84
-
85
-
86
-
87
-
88
-
89
-
90
-
91
-
92
-
93
-
94
-
95
-
96
-
97
-
98
-
99
-
100
-
101
-
102
-
103
-
104
-
105
-
106
-
 107
107 -
 108
108 -
 109
109 -
 110
110 -
 111
111 -
 112
112 -
 113
113 -
 114
114 -
 115
115 -
 116
116 -
 117
117 -
 118
118 -
 119
119 -
 120
120 -
 121
121 -
 122
122 -
 123
123 -
 124
124 -
 125
125 -
 126
126 -
 127
127 -
128
-
129
-
130
-
131
-
132
-
133
-
134
-
135
-
136
-
137
-
138
-
139
-
140
-
141
-
142
-
143
-
144
-
145
-
146
-
147
-
148
-
149
-
150
-
151
-
152
-
153
-
154
-
155
-
156
-
157
-
158
-
159
-
160
-
161
-
162
-
163
-
164
-
165
-
166
-
167
-
168
-
169
-
170
-
171
-
172
-
173
-
174
-
175
-
176
-
177
-
178
-
179
-
180
-
181
-
182
-
183
-
184
-
185
-
186
-
187
-
188
-
189
-
190
-
191
-
192
-
193
-
194
-
195
-
196
-
197
-
198
-
199
-
200
-
201
-
202
-
203
-
204
-
205
-
206
-
207
-
208
-
209
-
210
-
211
-
212
-
213
-
214
-
215
-
216
-
217
-
218
-
219
-
220
-
221
-
222
-
223
-
224
-
225
-
226
-
227
-
228
-
229
-
230
-
231
-
232
-
233
-
234
-
235
-
236
-
237
-
238
-
239
-
240
-
241
-
242
-
243
-
244
-
245
-
246
-
247
-
248
-
249
-
250
-
251
-
252
 |
 |

MD&A CRITICAL ACCOUNTING ESTIMATES
GE 2015 FORM 10-K 89
We review identified intangible assets with defined useful lives and subject to amortization for impairment whenever events or changes
in circumstances indicate that the related carrying amounts may not be recoverable. Determining whether an impairment loss occurred
requires comparing the carrying amount to the sum of undiscounted cash flows expected to be generated by the asset. We test
intangible assets with indefinite lives annually for impairment using a fair value method such as discounted cash flows. For our
insurance activities remaining in continuing operations, we periodically test for impairment our deferred acquisition costs and present
value of future profits.
Further information is provided in Notes 1 and 8 to the consolidated financial statements.
BUSINESSES AND ASSETS HELD FOR SALE
Businesses held for sale represent components that meet the accounting requirements to be classified as held for sale and are
presented as single asset and liability amounts in our financial statements with a valuation allowance, if necessary, to recognize the net
carrying amount at the lower of cost or fair value, less cost to sell. Financing receivables that no longer qualify to be presented as held
for investment must be classified as held for sale and recognized in our financial statements at the lower of cost or fair value, less cost
to sell, with that amount representing a new cost basis at the date of transfer.
The determination of fair value for businesses and portfolios of financing receivables involves significant judgments and assumptions.
Development of estimates of fair values in this circumstance is complex and is dependent upon, among other factors, the nature of the
potential sales transaction (for example, asset sale versus sale of legal entity), composition of assets and/or businesses in the disposal
group, the comparability of the disposal group to market transactions, negotiations with third party purchasers, etc. Such factors bear
directly on the range of potential fair values and the selection of the best estimates. Key assumptions were developed based on market
observable data and, in the absence of such data, internal information that is consistent with what market participants would use in a
hypothetical transaction.
We review all businesses and assets held for sale each reporting period to determine whether the existing carrying amounts are fully
recoverable in comparison to estimated fair values.
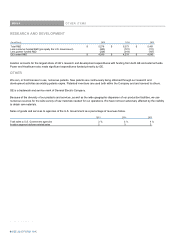
PENSION ASSUMPTIONS
Pension assumptions are significant inputs to the actuarial models that measure pension benefit obligations and related effects on
operations. Two assumptions ± discount rate and expected return on assets ± are important elements of plan expense and
asset/liability measurement. We evaluate these critical assumptions at least annually on a plan and country-specific basis. We
periodically evaluate other assumptions involving demographic factors such as retirement age, mortality and turnover, and update them
to reflect our experience and expectations for the future. Actual results in any given year will often differ from actuarial assumptions
because of economic and other factors.
Projected benefit obligations are measured as the present value of expected payments. We discount those cash payments using the
weighted average of market-observed yields for high-quality fixed-income securities with maturities that correspond to the payment of
benefits. Lower discount rates increase present values and subsequent-year pension expense; higher discount rates decrease present
values and subsequent-year pension expense.
Our discount rates for principal pension plans at December 31, 2015, 2014 and 2013 were 4.38%, 4.02% and 4.85%, respectively,
reflecting market interest rates.
GE 2015 FORM 10-K 89