GE 2015 Annual Report Download - page 189
Download and view the complete annual report
Please find page 189 of the 2015 GE annual report below. You can navigate through the pages in the report by either clicking on the pages listed below, or by using the keyword search tool below to find specific information within the annual report.-
 1
1 -
2
-
3
-
4
-
5
-
6
-
7
-
8
-
9
-
10
-
11
-
12
-
13
-
14
-
15
-
16
-
17
-
18
-
19
-
20
-
21
-
22
-
23
-
24
-
25
-
26
-
27
-
28
-
29
-
30
-
31
-
32
-
33
-
34
-
35
-
36
-
37
-
38
-
39
-
40
-
41
-
42
-
43
-
44
-
45
-
46
-
47
-
48
-
49
-
50
-
51
-
52
-
53
-
54
-
55
-
56
-
57
-
58
-
59
-
60
-
61
-
62
-
63
-
64
-
65
-
66
-
67
-
68
-
69
-
70
-
71
-
72
-
73
-
74
-
75
-
76
-
77
-
78
-
79
-
80
-
81
-
82
-
83
-
84
-
85
-
86
-
87
-
88
-
89
-
90
-
91
-
92
-
93
-
94
-
95
-
96
-
97
-
98
-
99
-
100
-
101
-
102
-
103
-
104
-
105
-
106
-
107
-
108
-
109
-
110
-
111
-
112
-
113
-
114
-
115
-
116
-
117
-
118
-
119
-
120
-
121
-
122
-
123
-
124
-
125
-
126
-
127
-
128
-
129
-
130
-
131
-
132
-
133
-
134
-
135
-
136
-
137
-
138
-
139
-
140
-
141
-
142
-
143
-
144
-
145
-
146
-
147
-
148
-
149
-
150
-
151
-
152
-
153
-
154
-
155
-
156
-
157
-
158
-
159
-
160
-
161
-
162
-
163
-
164
-
165
-
166
-
167
-
168
-
169
-
170
-
171
-
172
-
173
-
174
-
175
-
176
-
177
-
178
-
 179
179 -
 180
180 -
 181
181 -
 182
182 -
 183
183 -
 184
184 -
 185
185 -
 186
186 -
 187
187 -
 188
188 -
 189
189 -
 190
190 -
 191
191 -
 192
192 -
 193
193 -
 194
194 -
 195
195 -
 196
196 -
 197
197 -
 198
198 -
 199
199 -
200
-
201
-
202
-
203
-
204
-
205
-
206
-
207
-
208
-
209
-
210
-
211
-
212
-
213
-
214
-
215
-
216
-
217
-
218
-
219
-
220
-
221
-
222
-
223
-
224
-
225
-
226
-
227
-
228
-
229
-
230
-
231
-
232
-
233
-
234
-
235
-
236
-
237
-
238
-
239
-
240
-
241
-
242
-
243
-
244
-
245
-
246
-
247
-
248
-
249
-
250
-
251
-
252
 |
 |

FINANCIAL STATEMENTS ACQUISITIONS & INTANGIBLE ASSETS
GE 2015 FORM 10-K 161
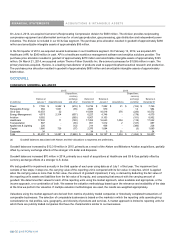
Under the income approach, fair value is determined based on the present value of estimated future cash flows, discounted at an
appropriate risk-adjusted rate. We use our internal forecasts to estimate future cash flows and include an estimate of long-term future
growth rates based on our most recent views of the long-term outlook for each business. Actual results may differ from those assumed
in our forecasts. We derive our discount rates using a capital asset pricing model and analyzing published rates for industries relevant
to our reporting units to estimate the cost of equity financing. We use discount rates that are commensurate with the risks and
uncertainty inherent in the respective businesses and in our internally developed forecasts. Discount rates used in our reporting unit
valuations ranged from 10.0% to 15.5%.
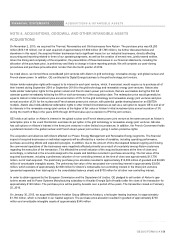
During the third quarter of 2015, we performed our annual impairment test of goodwill for all of our reporting units. Based on the results
of our step one testing, the fair values of each of the GE reporting units exceeded their carrying values; therefore, the second step of
the impairment test was not required to be performed for any of our reporting units and no goodwill impairment was recognized.
While all of our reporting units passed step one of our annual impairment testing in 2015, we identified one reporting unit for which the
fair value was not substantially in excess of its carrying value. Due to the sharp decline experienced in oil prices and the prospect of a
continuation of prevailing oil prices, the fair value of our Energy Financial Services reporting unit, within our Capital operating segment,
has been impacted and was in excess of its carrying value by approximately 13%. Due to the continued decline in oil prices, we
performed an impairment test in the fourth quarter using data as of December 31, 2015, which resulted in the fair value of our Energy
Financial Services reporting unit being in excess of its carrying value by approximately 12%. The goodwill associated with our Energy
Financial Services reporting unit was $1,386 million at December 31, 2015, representing approximately 2% of our total goodwill. Our Oil
& Gas business has also experienced declines in orders, project commencement delays and pricing pressures, which affect the fair
value of our Oil & Gas reporting units. While the goodwill of these reporting units is not currently impaired, we will continue to monitor
the oil & gas industry and the impact it may have on these businesses.
As of December 31, 2015, we believe that the goodwill is recoverable for all of the reporting units; however, there can be no assurances
that the goodwill will not be impaired in future periods.
In 2014, we identified one reporting unit for which the fair value was not substantially in excess of its carrying value. Within our Energy
Management operating segment, the Power Conversion reporting unit was determined to have a fair value in excess of its carrying
value by approximately 10%. In the current year, the fair value of the Power Conversion reporting unit significantly exceeded its carrying
value. The increase in fair value over its carrying value was driven primarily by a stabilization of the business and cost cutting
measures. In addition, our carrying value has decreased due to currency effects of a stronger U.S. dollar.
Estimating the fair value of reporting units requires the use of estimates and significant judgments that are based on a number of
factors including actual operating results. It is reasonably possible that the judgments and estimates described above could change in
future periods.
GE 2015 FORM 10-K 161