Frontier Communications 2004 Annual Report Download - page 6
Download and view the complete annual report
Please find page 6 of the 2004 Frontier Communications annual report below. You can navigate through the pages in the report by either clicking on the pages listed below, or by using the keyword search tool below to find specific information within the annual report.-
 1
1 -
 2
2 -
 3
3 -
 4
4 -
 5
5 -
 6
6 -
 7
7 -
 8
8 -
 9
9 -
 10
10 -
 11
11 -
 12
12 -
 13
13 -
 14
14 -
 15
15 -
 16
16 -
 17
17 -
18
-
19
-
20
-
21
-
22
-
23
-
24
-
25
-
26
-
27
-
28
-
29
-
30
-
31
-
32
-
33
-
34
-
35
-
36
-
37
-
38
-
39
-
40
-
41
-
42
-
43
-
44
-
45
-
46
-
47
-
48
-
49
-
50
-
51
-
52
-
53
-
54
-
55
-
56
-
57
-
58
-
59
-
60
-
61
-
62
-
63
-
64
-
65
-
66
-
67
-
68
-
69
-
70
-
71
-
72
-
73
-
74
-
75
-
76
-
77
-
78
-
79
-
80
-
81
-
82
-
83
-
84
-
85
-
86
-
87
-
88
-
89
-
90
-
91
-
92
-
93
-
94
-
95
-
96
 |
 |

CITIZENS COMMUNICATIONS COMPANY AND SUBSIDIARIES
4
service which generates advertising revenue. We recognize the revenue from these services over the life of the related white or
yellow pages book.
During 2005 we will begin selling voice over internet protocol or VOIP solutions to commercial customers in certain of our
markets and, through a relationship with a satellite television operator, we will be bundling and selling television services to
our residential customers in all our markets. We will also consider providing wireless internet access in some of our markets.
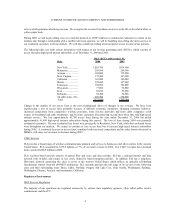
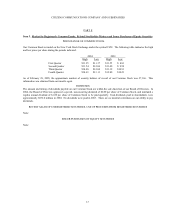
The following table sets forth certain information with respect to our revenue generating units (RGUs), which consists of
access lines plus high-speed internet subscribers, as of December 31, 2004 and 2003.
ILEC RGUs at December 31,
State 2004 2003
New York ................. 1,029,700 1,034,300
Minnesota ................. 289,300 284,300
Arizona ..................... 182,000 175,500
West Virginia............ 179,400 167,200
California .................. 165,000 163,200
Illinois ....................... 128,600 127,900
Tennessee.................. 104,500 101,800
Wisconsin ................. 77,600 76,800
Iowa .......................... 62,100 63,000
Nebraska ................... 54,400 54,900
All other states (13)... 260,400 258,000
Total 2,533,000 2,506,900
Change in the number of our access lines is the most fundamental driver of changes in our revenue. We have been
experiencing a loss of access lines primarily because of difficult economic conditions, changing consumer behavior,
increased competition from competitive wireline providers, from wireless providers and from cable companies (with
respect to broadband and cable telephony), and by some customers disconnecting second lines when they add high-speed
internet service. We lost approximately 65,700 access lines during the year ended December 31, 2004 but added
approximately 91,800 high-speed internet subscribers during this period. The loss of lines during 2004 was primarily
residential customers. The non-residential line losses were principally in Rochester, New York, while the residential losses
were throughout our markets. We expect to continue to lose access lines but to increase high-speed internet subscribers
during 2005. A continued decrease in access lines, combined with increased competition and the other factors discussed in
MD&A, will cause our revenues to decrease during 2005.
CLEC Services
ELI provides a broad range of wireline communications products and services to businesses and other carriers in the western
United States. ELI accounted for $156.0 million, or 7%, of our total revenues in 2004. Our CLEC revenues have declined
from a peak of $240.8 million in 2000.
ELI's facilities-based network consists of optical fiber and voice and data switches. ELI has a national internet and data
network with switches and routers in key cities, linked by leased transport facilities. In addition, ELI has a long-haul,
fiber-optic network connecting the cities it serves in the western United States which utilizes an optically self-healing
Synchronous Optical Network (SONET) architecture. ELI currently provides the full range of its services in the following
cities and their surrounding areas: Boise, Idaho; Portland, Oregon; Salt Lake City, Utah; Seattle, Washington; Spokane,
Washington; Phoenix, Arizona; and Sacramento, California.
Regulatory Environment
ILEC Services Regulation
The majority of our operations are regulated extensively by various state regulatory agencies, often called public service
commissions, and the FCC.