Frontier Communications 2004 Annual Report Download - page 33
Download and view the complete annual report
Please find page 33 of the 2004 Frontier Communications annual report below. You can navigate through the pages in the report by either clicking on the pages listed below, or by using the keyword search tool below to find specific information within the annual report.-
 1
1 -
2
-
3
-
4
-
5
-
6
-
7
-
8
-
9
-
10
-
11
-
12
-
13
-
14
-
15
-
16
-
17
-
18
-
19
-
20
-
21
-
22
-
 23
23 -
 24
24 -
 25
25 -
 26
26 -
 27
27 -
 28
28 -
 29
29 -
 30
30 -
 31
31 -
 32
32 -
 33
33 -
 34
34 -
 35
35 -
 36
36 -
 37
37 -
 38
38 -
 39
39 -
 40
40 -
 41
41 -
 42
42 -
 43
43 -
44
-
45
-
46
-
47
-
48
-
49
-
50
-
51
-
52
-
53
-
54
-
55
-
56
-
57
-
58
-
59
-
60
-
61
-
62
-
63
-
64
-
65
-
66
-
67
-
68
-
69
-
70
-
71
-
72
-
73
-
74
-
75
-
76
-
77
-
78
-
79
-
80
-
81
-
82
-
83
-
84
-
85
-
86
-
87
-
88
-
89
-
90
-
91
-
92
-
93
-
94
-
95
-
96
 |
 |

CITIZENS COMMUNICATIONS COMPANY AND SUBSIDIARIES
31
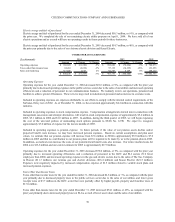
Sales and Marketing
Sales and marketing expenses for the year ended December 31, 2004 increased $2.7 million, or 2%, as compared with the prior
year primarily due to increased costs in the ILEC sector.
Sales and marketing expenses for the year ended December 31, 2003 increased $4.2 million, or 4%, as compared to the prior year
due to increased marketing costs in the ILEC sector primarily related to enhanced services and high-speed internet.
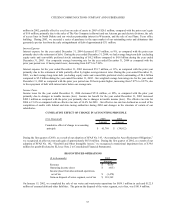
Depreciation expense for the year ended December 31, 2004 decreased $22.2 million, or 5% as compared to the prior year
because the net asset base is declining.
Depreciation expense for the year ended December 31, 2003 decreased $161.7 million, or 26%, as compared with the prior year
primarily due to the ELI impairment charge recognized during the third quarter of 2002, which reduced ELI’s asset base, the
adoption of SFAS No. 143 and the increase in the average depreciable lives for certain of our equipment. Accelerated
depreciation in 2002 of $23.4 million relating to the closing of our Plano, Texas facility also contributed to the decrease.
Amortization expense for the year ended December 31, 2003 increased $1.4 million, or 1% as compared with the prior year
primarily due to the receipt of the final valuation report of our Frontier acquisition during the second quarter of 2002, which
resulted in an increase in our customer base.
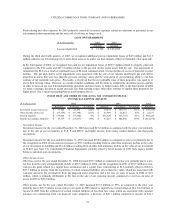
Management succession and strategic alternatives expenses in 2004 include a mix of cash retention payments, equity awards
and severance agreements (see Note 13 to Consolidated Financial Statements for a complete discussion).
During the fourth quarter of 2003, an agreement with WorldCom/MCI settling all pre-bankruptcy petition obligations and
receivables was approved by the bankruptcy court. This settlement resulted in reduction to our reserve of approximately $6.6
million in the fourth quarter of 2003. During the second quarter of 2003, we reserved approximately $2.3 million of trade
receivables with Touch America as a result of Touch America’s filing for bankruptcy. These receivables were generated as a
result of providing ordinary course telecommunication services. If other telecommunications companies file for bankruptcy, we
may have additional significant reserves in future periods.
Concurrent with the acquisition of Frontier, we entered into several operating agreements with Global Crossing. We have
ongoing commercial relationships with Global Crossing affiliates. We reserved a total of $29.0 million of Global Crossing
receivables during 2001 and 2002 as a result of Global Crossing’s filing for bankruptcy to reflect our best estimate of the net
realizable value of receivables resulting from these commercial relationships. We recorded a write-down of such receivables
in the amount of $7.8 million in 2002 and $21.2 million in 2001. In 2002, as the result of a settlement agreement with Global
Crossing, we reversed $17.9 million of our previous write-down reserve of the net realizable value of these receivables.
($ in thousands) 2002
Amount $ Change % Change Amount $ Change % Change Amount
Depreciation expense 446,190$ (22,248)$ -5% 468,438$ (161,675)$ -26% 630,113$
Amortization expense 126,520 (318) 0% 126,838 1,429 1% 125,409
572,710$ (22,566)$ -4% 595,276$ (160,246)$ -21% 755,522$
2004 2003
DEPRECIATION AND AMORTIZATION EXPENSE
($ in thousands) 2002
Amount $ Change % Change Amount $ Change % Change Amount
Reserve for (recovery of) telecommunications
bankruptcies -$ 4,377$ -100% (4,377)$ (15,257)$ -140% 10,880$
Restructuring and other expenses -$ (9,687)$ -100% 9,687$ (27,499)$ -74% 37,186$
Management succession and
strategic alternatives expenses 90,632$ 90,632$ 100% -$ -$ 0% -$
MANAGEMENT SUCCESSION AND STRATEGIC ALTERNATIVES EXPENSES
RESERVE FOR TELECOMMUNICATIONS BANKRUPTCIES / RESTRUCTURING AND OTHER EXPENSES /
20032004