Frontier Communications 2004 Annual Report Download - page 51
Download and view the complete annual report
Please find page 51 of the 2004 Frontier Communications annual report below. You can navigate through the pages in the report by either clicking on the pages listed below, or by using the keyword search tool below to find specific information within the annual report.-
 1
1 -
2
-
3
-
4
-
5
-
6
-
7
-
8
-
9
-
10
-
11
-
12
-
13
-
14
-
15
-
16
-
17
-
18
-
19
-
20
-
21
-
22
-
23
-
24
-
25
-
26
-
27
-
28
-
29
-
30
-
31
-
32
-
33
-
34
-
35
-
36
-
37
-
38
-
39
-
40
-
 41
41 -
 42
42 -
 43
43 -
 44
44 -
 45
45 -
 46
46 -
 47
47 -
 48
48 -
 49
49 -
 50
50 -
 51
51 -
 52
52 -
 53
53 -
 54
54 -
 55
55 -
 56
56 -
 57
57 -
 58
58 -
 59
59 -
 60
60 -
 61
61 -
62
-
63
-
64
-
65
-
66
-
67
-
68
-
69
-
70
-
71
-
72
-
73
-
74
-
75
-
76
-
77
-
78
-
79
-
80
-
81
-
82
-
83
-
84
-
85
-
86
-
87
-
88
-
89
-
90
-
91
-
92
-
93
-
94
-
95
-
96
 |
 |

F-7
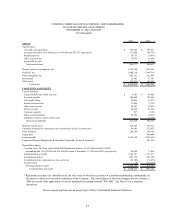
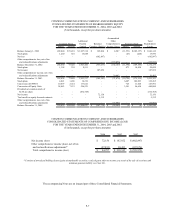
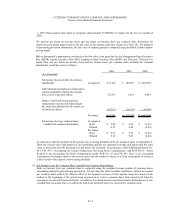
CITIZENS COMMUNICATIONS COMPANY AND SUBSIDIARIES
CONSOLIDATED STATEMENTS OF SHAREHOLDERS' EQUITY
FOR THE YEARS ENDED DECEMBER 31, 2004, 2003 and 2002
($ in thousands, except for per-share amounts)
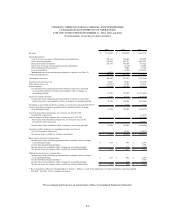
CITIZENS COMMUNICATIONS COMPANY AND SUBSIDIARIES
CONSOLIDATED STATEMENTS OF COMPREHENSIVE INCOME (LOSS)
FOR THE YEARS ENDED DECEMBER 31, 2004, 2003 and 2002
($ in thousands, except for per-share amounts)
* Consists of unrealized holding (losses)/gains of marketable securities, realized gains taken to income as a result of the sale of securities and
minimum pension liability (see Note 22).
The accompanying Notes are an integral part of these Consolidated Financial Statements.
2004 2003 2002
Net income (loss) 72,150$ 187,852$ (682,897)$
Other comprehensive income (loss), net of tax
and reclassifications adjustments* (27,893) 30,493 (107,076)
Total comprehensive income (loss) 44,257$ 218,345$ (789,973)$
Accumulated
Additional Other Total
Paid-In Retained Comprehensive Shareholders'
Shares Amount Capital Earnings (Deficit) Income (Loss) Shares Amount Equity
Balance January 1, 2002 292,840 73,210$ 1,927,518$ 129,864$ 4,907$ (11,551) (189,357)$ 1,946,142$
Stock plans 1,240 310 15,888 - - (47) (228) 15,970
Net loss - - - (682,897) - - - (682,897)
Other comprehensive loss, net of tax
and reclassifications adjustments - - - - (107,076) - - (107,076)
Balance December 31, 2002 294,080 73,520 1,943,406 (553,033) (102,169) (11,598) (189,585) 1,172,139
Stock plans 1,354 338 9,911 - - 873 14,450 24,699
Net income - - - 187,852 - - - 187,852
Other comprehensive income, net of tax
and reclassifications adjustments - - - - 30,493 - - 30,493
Balance December 31, 2003 295,434 73,858 1,953,317 (365,181) (71,676) (10,725) (175,135) 1,415,183
Stock plans 4,821 1,206 14,236 - - 6,407 106,823 122,265
Conversion of EPPICS 10,897 2,724 133,621 - - 725 11,646
147,991
Conversion of Equity Units 28,483 7,121 396,221 - - 3,591 56,658 460,000
Dividends on common stock of
$2.50 per share - - (832,768) - - - - (832,768)
Net income - - - 72,150 - - - 72,150
Tax benefit on equity forward contracts - - - 5,312 - - - 5,312
Other comprehensive loss, net of tax
and reclassifications adjustments - - - - (27,893) - - (27,893)
Balance December 31, 2004 339,635 84,909$ 1,664,627$ (287,719)$ (99,569)$ (2) (8)$ 1,362,240$
Common Stock Treasury Stock