Frontier Communications 2004 Annual Report Download - page 52
Download and view the complete annual report
Please find page 52 of the 2004 Frontier Communications annual report below. You can navigate through the pages in the report by either clicking on the pages listed below, or by using the keyword search tool below to find specific information within the annual report.-
 1
1 -
2
-
3
-
4
-
5
-
6
-
7
-
8
-
9
-
10
-
11
-
12
-
13
-
14
-
15
-
16
-
17
-
18
-
19
-
20
-
21
-
22
-
23
-
24
-
25
-
26
-
27
-
28
-
29
-
30
-
31
-
32
-
33
-
34
-
35
-
36
-
37
-
38
-
39
-
40
-
41
-
 42
42 -
 43
43 -
 44
44 -
 45
45 -
 46
46 -
 47
47 -
 48
48 -
 49
49 -
 50
50 -
 51
51 -
 52
52 -
 53
53 -
 54
54 -
 55
55 -
 56
56 -
 57
57 -
 58
58 -
 59
59 -
 60
60 -
 61
61 -
 62
62 -
63
-
64
-
65
-
66
-
67
-
68
-
69
-
70
-
71
-
72
-
73
-
74
-
75
-
76
-
77
-
78
-
79
-
80
-
81
-
82
-
83
-
84
-
85
-
86
-
87
-
88
-
89
-
90
-
91
-
92
-
93
-
94
-
95
-
96
 |
 |

F-8
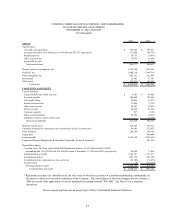
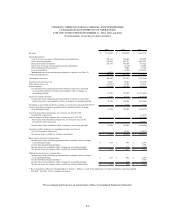
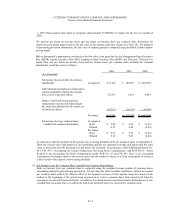
CITIZENS COMMUNICATIONS COMPANY AND SUBSIDIARIES
CONSOLIDATED STATEMENTS OF CASH FLOWS
FOR THE YEARS ENDED DECEMBER 31, 2004, 2003 and 2002
($ in thousands)
The accompanying Notes are an integral part of these Consolidated Financial Statements.
2004 2003 2002
Income (loss) from continuing operations before cumulative
effect of change in accounting principle 72,150$ 122,083$ (822,976)$
Adjustments to reconcile net income (loss) to net cash
provided by operating activities:
Depreciation and amortization expense 572,710 595,276 755,522
Investment write-downs - - 117,455
Gain on expiration/settlement of customer advance (25,345) (6,165) (26,330)
Gain on capital lease termination/restructuring - (69,512) -
Stock based compensation expense 45,313 8,552 7,029
(Gain)/loss on extinguishment of debt 66,480 10,851 (5,550)
Investment (gains)/losses (12,066) - (3,363)
(Gain)/loss on sales of assets, net 1,945 20,492 (9,798)
Loss on impairment - 15,300 1,074,058
Other non-cash adjustments 21,923 14,574 18,762
Deferred taxes, net 13,379 67,216 (414,874)
Change in accounts receivable 11,877 70,077 1,373
Change in accounts payable and other liabilities (51,460) (106,567) (161,367)
Change in other current assets 169 999 101,376
Net cash provided by continuing operating activities 717,075 743,176 631,317
Cash flows from investing activities:
Proceeds from sales of assets, net of selling expenses 30,959 388,079 224,678
Capital expenditures (276,348) (278,015) (468,742)
Securities purchased - (1,680) (1,175)
Securities sold 26,514 - 8,212
Securities matured - - 2,014
ELI share purchases - - (6,800)
Other asset purchases (28,110) 68 727
Net cash provided from (used by) investing activities (246,985) 108,452 (241,086)
Cash flows from financing activities:
Repayment of customer advances for construction
and contributions in aid of construction (2,089) (10,030) (4,895)
Long-term debt borrowings 700,000 - -
Debt issuance costs (15,502) - -
Long-term debt payments (1,214,021) (653,462) (1,062,169)
(Premium) discount to retire debt (66,480) (10,851) 5,550
Issuance of common stock 544,562 13,209 14,943
Dividends paid (832,768) - -
Net cash used by financing activities (886,298) (661,134) (1,046,571)
Cash provided by (used by) discontinued operations
Proceeds from sale of discontinued operations - - 859,064
Net cash used by discontinued operations - - (25,416)
Increase (decrease) in cash and cash equivalents (416,208) 190,494 177,308
Cash and cash equivalents at January 1, 583,671 393,177 215,869
Cash and cash equivalents at December 31, 167,463$ 583,671$ 393,177$
Cash paid during the period for:
Interest 370,128$ 418,561$ 473,029$
Income taxes (refunds) (4,901)$ (2,532)$ (17,621)$
Non-cash investing and financing activities:
Assets acquired under capital lease -$ -$ 38,000$
Change in fair value of interest rate swaps (6,135)$ (6,057)$ 16,229$
Investment write-downs 5,286$ -$ 117,455$
Conversion of EPPICS 147,991$ -$ -$