Frontier Communications 2004 Annual Report Download - page 29
Download and view the complete annual report
Please find page 29 of the 2004 Frontier Communications annual report below. You can navigate through the pages in the report by either clicking on the pages listed below, or by using the keyword search tool below to find specific information within the annual report.-
 1
1 -
2
-
3
-
4
-
5
-
6
-
7
-
8
-
9
-
10
-
11
-
12
-
13
-
14
-
15
-
16
-
17
-
18
-
 19
19 -
 20
20 -
 21
21 -
 22
22 -
 23
23 -
 24
24 -
 25
25 -
 26
26 -
 27
27 -
 28
28 -
 29
29 -
 30
30 -
 31
31 -
 32
32 -
 33
33 -
 34
34 -
 35
35 -
 36
36 -
 37
37 -
 38
38 -
 39
39 -
40
-
41
-
42
-
43
-
44
-
45
-
46
-
47
-
48
-
49
-
50
-
51
-
52
-
53
-
54
-
55
-
56
-
57
-
58
-
59
-
60
-
61
-
62
-
63
-
64
-
65
-
66
-
67
-
68
-
69
-
70
-
71
-
72
-
73
-
74
-
75
-
76
-
77
-
78
-
79
-
80
-
81
-
82
-
83
-
84
-
85
-
86
-
87
-
88
-
89
-
90
-
91
-
92
-
93
-
94
-
95
-
96
 |
 |

CITIZENS COMMUNICATIONS COMPANY AND SUBSIDIARIES
27
Consolidated revenue increased $212.3 million, or 9%, in 2002. The increase in 2002 was primarily due to $420.5 million of
increased telecommunications revenue, largely due to the impact of the Frontier acquisition on June 29, 2001, partially offset by
$195.0 million of decreased gas revenue largely due to the disposition of the Louisiana and Colorado gas operations and the
disposition of the Kauai electric division.
On October 31, 2002 and April 1, 2003, we sold approximately 4,000 and 11,000 telephone access lines, respectively, in
North Dakota. The revenues related to these access lines totaled $1.9 million; $10.2 million and $11.1 million for the years
ended December 31, 2003, 2002 and 2001, respectively.
Change in the number of our access lines is the most fundamental driver of changes in our telecommunications revenue. We
have been losing access lines primarily because of difficult economic conditions, increased competition from competitive
wireline providers, from wireless providers and from cable companies (with respect to broadband and cable telephony), and
by some customers disconnecting second lines when they add high-speed internet or cable modem service. We lost
approximately 65,700 access lines during 2004 but added approximately 91,800 high-speed internet subscribers during this
period. The loss of lines during 2004 was primarily among residential customers. The non-residential line losses were
principally in Rochester, New York, while the residential losses were throughout our markets. We expect to continue to lose
access lines but to increase high-speed internet subscribers during 2005. A continued loss of access lines, combined with
increased competition and the other factors discussed in MD&A, will cause our revenues to decrease in 2005. In addition, we
have entered into a definitive agreement to sell our conferencing services business, which had revenue of $24.6 million during
2004.
Access Services
Access services revenue for the year ended December 31, 2004 decreased $32.8 million or 5%, as compared with the prior
year. Switched access revenue decreased $19.6 million primarily due to $8.3 million attributable to a decline in minutes of
use, the $7.4 million effect of federally mandated access rate reductions and $2.7 million associated with state intrastate
access rate reductions. Access service revenue includes subsidy payments we receive from federal and state agencies.
Subsidies revenue decreased $12.8 million primarily due to an $8.3 million decline in federal Universal Service Fund (USF)
support because of increases in the national average cost per loop, including a $3.5 million accrual recorded during the third
quarter of 2004 for mistakes made during 2002 and 2003 by the agency that calculates subsidy payments and true-ups related
to 2002. The decreases were partially offset by an increase in USF surcharge revenue of $2.1 million resulting from a rate
increase.
Access services revenue for the year ended December 31, 2003 decreased $24.9 million or 4% as compared with the prior
year. Switched access revenue decreased $20.7 million primarily due to the $18.1 million effect of federally mandated access
rate reductions, $2.6 million in increased disputes and $1.2 million related to the sale of our North Dakota exchanges. Special
access revenue increased $4.6 million primarily due to growth in special (point-to-point) circuits of $8.4 million partially
offset by a decrease of $1.7 million attributable to the sale of our North Dakota exchanges and $1.2 million in increased
disputes. Subsidy revenue decreased $8.7 million primarily due to decreased USF support of $11.8 million partially offset by
an increase of $4.9 million in USF surcharge rates.
We currently expect that our subsidy revenue in 2005 will be at least $20.0 million lower than 2004 because of the
improvement in prior years in the profitability of our operations and lower expenses and capital expenditures in prior years
than previously anticipated, and because of increases in the national average cost per loop (NACPL). Increases in the number
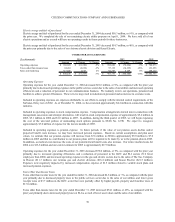
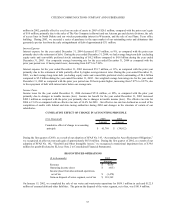
($ in thousands) 2002
Amount $ Change % Change Amount $ Change % Change Amount
Access services 634,196$ (32,846)$ -5% 667,042$ (24,852)$ -4% 691,894$
Local services 851,177 (7,825) -1% 859,002 8,683 1% 850,319
Long distance and data services 321,854 15,020 5% 306,834 7,508 3% 299,326
Directory services 110,623 3,689 3% 106,934 2,551 2% 104,383
Other 109,365 8,242 8% 101,123 (15,860) -14% 116,983
ILEC revenue 2,027,215 (13,720) -1% 2,040,935 (21,970) -1% 2,062,905
ELI 156,030 (9,359) -6% 165,389 (9,690) -6% 175,079
2,183,245$ (23,079)$ -1% 2,206,324$ (31,660)$ -1% 2,237,984$
TELECOMMUNICATIONS REVENUE
2004 2003