Electronic Arts 2016 Annual Report Download - page 47
Download and view the complete annual report
Please find page 47 of the 2016 Electronic Arts annual report below. You can navigate through the pages in the report by either clicking on the pages listed below, or by using the keyword search tool below to find specific information within the annual report.-
 1
1 -
2
-
3
-
4
-
5
-
6
-
7
-
8
-
9
-
10
-
11
-
12
-
13
-
14
-
15
-
16
-
17
-
18
-
19
-
20
-
21
-
22
-
23
-
24
-
25
-
26
-
27
-
28
-
29
-
30
-
31
-
32
-
33
-
34
-
35
-
36
-
 37
37 -
 38
38 -
 39
39 -
 40
40 -
 41
41 -
 42
42 -
 43
43 -
 44
44 -
 45
45 -
 46
46 -
 47
47 -
 48
48 -
 49
49 -
 50
50 -
 51
51 -
 52
52 -
 53
53 -
 54
54 -
 55
55 -
 56
56 -
 57
57 -
58
-
59
-
60
-
61
-
62
-
63
-
64
-
65
-
66
-
67
-
68
-
69
-
70
-
71
-
72
-
73
-
74
-
75
-
76
-
77
-
78
-
79
-
80
-
81
-
82
-
83
-
84
-
85
-
86
-
87
-
88
-
89
-
90
-
91
-
92
-
93
-
94
-
95
-
96
-
97
-
98
-
99
-
100
-
101
-
102
-
103
-
104
-
105
-
106
-
107
-
108
-
109
-
110
-
111
-
112
-
113
-
114
-
115
-
116
-
117
-
118
-
119
-
120
-
121
-
122
-
123
-
124
-
125
-
126
-
127
-
128
-
129
-
130
-
131
-
132
-
133
-
134
-
135
-
136
-
137
-
138
-
139
-
140
-
141
-
142
-
143
-
144
-
145
-
146
-
147
-
148
-
149
-
150
-
151
-
152
-
153
-
154
-
155
-
156
-
157
-
158
-
159
-
160
-
161
-
162
-
163
-
164
-
165
-
166
-
167
-
168
-
169
-
170
-
171
-
172
-
173
-
174
-
175
-
176
-
177
-
178
-
179
-
180
-
181
-
182
-
183
-
184
-
185
-
186
-
187
-
188
 |
 |

Proxy Statement
(4)
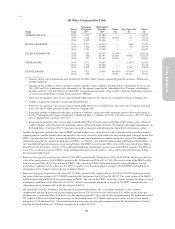
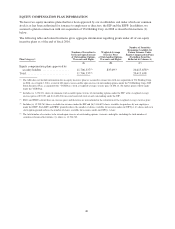
All Other Compensation Table
Name
Fiscal
Year
Insurance
Premiums
($)(A)
Retirement
Benefits
($)(B)
Other
($)
Tax Gross-Up
($)
Total
($)
ANDREW WILSON ................. 2016 1,071 15,900 — — 16,971
2015 1,118 15,600 38,462 75 55,255
2014 1,919 15,300 — — 17,219
BLAKE JORGENSEN ................ 2016 1,071 15,900 — 316(C) 17,287
2015 1,118 15,600 — 41 16,759
2014 1,124 15,300 — — 16,424
PATRICK SÖDERLUND ............. 2016 783 55,957 51,378(D) — 108,118
2015 702 68,797 62,204 9,908 141,611
2014 791 32,142 63,050 — 95,983
PETER MOORE .................... 2016 1,071 15,900 — 1,361(E) 18,332
2015 1,118 15,600 — — 16,718
2014 6,149 15,300 — 3,516 24,965
KENNETH MOSS ................... 2016 1,071 15,900 98,002(F) 37,794(G) 152,767
2015 839 — 37,923 36,475 75,237
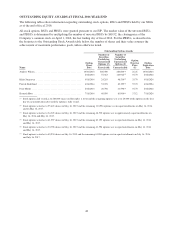
(A) Amounts shown represent premiums paid on behalf of our NEOs under Company sponsored group life insurance, AD&D and
disability programs.
(B) Amounts shown for Messrs. Wilson, Jorgensen, Moore and Moss reflect Company-matching 401(k) contributions for fiscal years
2014, 2015 and 2016, paid during each subsequent year. The amount shown for Mr. Söderlund reflects Company contributions
during fiscal 2014, 2015 and 2016 to a Swedish ITP2 occupational pension plan, which includes a defined contribution component,
as well as life and disability coverage, and an alternative ITP plan.
(C) Represents the aggregate value of taxes paid on behalf of Mr. Jorgensen for video game merchandise from the Company store.
(D) Includes car payments, paid time off and expired paid time off.
(E) Represents the aggregate value of taxes paid on behalf of Mr. Moore for costs incurred in connection with a Company sponsored
team event and for video game merchandise from the Company store.
(F) Represents amounts reimbursed to Mr. Moss or paid on his behalf in connection with commuting expenses between his home in
Seattle, Washington and Company headquarters in Redwood Shores, California ($26,529), relocation assistance ($43,757) and tax
advice and preparation assistance ($27,716).
(G) Represents the aggregate value of taxes paid on behalf of Mr. Moss for video game merchandise from Company store, videogame
credits, Company paid or reimbursed commuting expenses between his home in Seattle, Washington and Company headquarters in
Redwood Shores, California ($32,753) and costs incurred in connection with attending the Super Bowl with business partners.
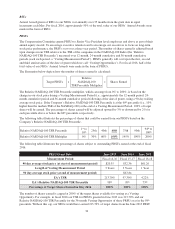
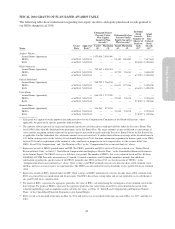
(5) Includes the aggregate grant date fair value of PRSUs granted in those years. Grant date fair value is determined for financial statement
reporting purposes and the amounts shown do not reflect the actual value that can be realized by the recipient upon vesting of awards. For
PRSUs, the grant date fair value is based on the probable outcome of the performance condition on the date of grant. For additional
information regarding the valuation methodology for PRSUs, see Note 15, “Stock-Based Compensation and Employee Benefit Plans,” to
the Consolidated Financial Statements in our Annual Report. The PRSUs granted to our NEOs in fiscal 2016 are referred to as “Market-
Based Restricted Stock Units” in Note 15. For additional information regarding the specific terms of the PRSUs granted to our NEOs in
fiscal 2016, see the discussion of “PRSUs” in the “Compensation Discussion & Analysis” above and the “Fiscal 2016 Grants of Plan-
Based Awards Table” below.
(6) Represents the aggregate grant date fair value of 95,450 RSUs granted to Mr. Wilson in fiscal 2016 of $5,999,987 and the grant date fair
value of the target payout of 95,450 PRSUs granted to Mr. Wilson in fiscal 2016 of $7,617,865. The actual vesting of the PRSUs will be
between zero and 200% of the target number of PRSUs. The value of the PRSUs on the date of grant assuming the highest level of
performance conditions will be achieved is $11,999,974, which is based on the maximum vesting of 190,900 PRSUs multiplied by the
closing price of our common stock on the date of grant of $62.86.
(7) Represents the aggregate grant date fair value of 47,725 RSUs granted to Mr. Jorgensen in fiscal 2016 of $2,999,994 and the grant date
fair value of the target payout of 47,725 PRSUs granted to Mr. Jorgensen in fiscal 2016 of $3,808,932. The actual vesting of the PRSUs
will be between zero and 200% of the target number of PRSUs. The value of the PRSUs on the date of grant assuming the highest level of
performance conditions will be achieved is $5,999,987, which is based on the maximum vesting of 95,450 PRSUs multiplied by the
closing price of our common stock on the date of grant of $62.86.
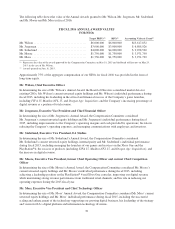
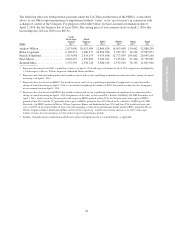
(8) Mr. Söderlund is based in Stockholm, Sweden and was paid in Swedish krona. The cash amounts reported as salary, all other
compensation and non-equity incentive plan compensation for our 2014 fiscal year were converted to U.S. dollars based on the spot
exchange rate as of the end of our 2014 fiscal year. The amounts reported as salary and all other compensation for Mr. Söderlund in fiscal
2015 and fiscal 2016 were derived from an average of the Swedish krona to U.S. dollar exchange rates on the last day of each month
during fiscal 2015 and fiscal 2016. The amount reported as non-equity incentive plan compensation for Mr. Söderlund in fiscal 2016 is
based on the Swedish krona to U.S. dollar exchange rate as of May 25, 2016.
39