Electronic Arts 2016 Annual Report Download - page 124
Download and view the complete annual report
Please find page 124 of the 2016 Electronic Arts annual report below. You can navigate through the pages in the report by either clicking on the pages listed below, or by using the keyword search tool below to find specific information within the annual report.-
 1
1 -
2
-
3
-
4
-
5
-
6
-
7
-
8
-
9
-
10
-
11
-
12
-
13
-
14
-
15
-
16
-
17
-
18
-
19
-
20
-
21
-
22
-
23
-
24
-
25
-
26
-
27
-
28
-
29
-
30
-
31
-
32
-
33
-
34
-
35
-
36
-
37
-
38
-
39
-
40
-
41
-
42
-
43
-
44
-
45
-
46
-
47
-
48
-
49
-
50
-
51
-
52
-
53
-
54
-
55
-
56
-
57
-
58
-
59
-
60
-
61
-
62
-
63
-
64
-
65
-
66
-
67
-
68
-
69
-
70
-
71
-
72
-
73
-
74
-
75
-
76
-
77
-
78
-
79
-
80
-
81
-
82
-
83
-
84
-
85
-
86
-
87
-
88
-
89
-
90
-
91
-
92
-
93
-
94
-
95
-
96
-
97
-
98
-
99
-
100
-
101
-
102
-
103
-
104
-
105
-
106
-
107
-
108
-
109
-
110
-
111
-
112
-
113
-
 114
114 -
 115
115 -
 116
116 -
 117
117 -
 118
118 -
 119
119 -
 120
120 -
 121
121 -
 122
122 -
 123
123 -
 124
124 -
 125
125 -
 126
126 -
 127
127 -
 128
128 -
 129
129 -
 130
130 -
 131
131 -
 132
132 -
 133
133 -
 134
134 -
135
-
136
-
137
-
138
-
139
-
140
-
141
-
142
-
143
-
144
-
145
-
146
-
147
-
148
-
149
-
150
-
151
-
152
-
153
-
154
-
155
-
156
-
157
-
158
-
159
-
160
-
161
-
162
-
163
-
164
-
165
-
166
-
167
-
168
-
169
-
170
-
171
-
172
-
173
-
174
-
175
-
176
-
177
-
178
-
179
-
180
-
181
-
182
-
183
-
184
-
185
-
186
-
187
-
188
 |
 |

do not decline proportionately with declines in our pre-tax consolidated income or loss. As a result, in absolute
dollar terms, our tax expense will have a greater influence on our effective tax rate at lower levels of pre-tax
income or loss than at higher levels. In addition, at lower levels of pre-tax income or loss, our effective tax rate
will be more volatile.
Historically, we have considered all undistributed earnings of our foreign subsidiaries to be indefinitely
reinvested outside of the United States and, accordingly, no U.S. taxes have been provided thereon. During the
fourth quarter of fiscal year 2016, we issued the Senior Notes and announced a $500 million stock repurchase
program. In light of these future obligations, we reevaluated our intent to indefinitely reinvest all earnings of
foreign subsidiary companies, and concluded that a portion of earnings of certain subsidiaries will no longer be
considered to be indefinitely reinvested. As a result, we have recognized a deferred tax liability of $43 million for
U.S. income taxes with respect to such earnings. We currently intend to continue to indefinitely reinvest a
substantial majority of the undistributed earnings of our foreign subsidiaries outside of the United States.
Comparison of Fiscal Year 2015 to Fiscal Year 2014
Net Revenue
For fiscal year 2015, net revenue was $4,515 million and increased $940 million, or 26 percent, as compared to
fiscal year 2014. This increase was driven by a $1,481 million increase in revenue primarily from the FIFA and
Madden NFL franchises, and Titanfall. This increase was partially offset by a $541 million decrease in revenue
primarily from the SimCity, Crysis, Dead Space, and NCAA Football franchises, and Star Wars: The Old
Republic.
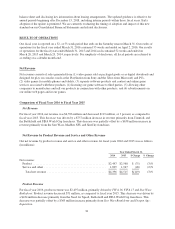
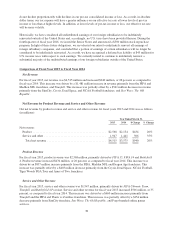
Net Revenue by Product Revenue and Service and Other Revenue
Our net revenue by product revenue and service and other revenue for fiscal years 2015 and 2014 was as follows
(in millions):
Year Ended March 31,
2015 2014 $ Change % Change
Net revenue:
Product .................................................. $2,568 $2,134 $434 20%
Service and other .......................................... 1,947 1,441 506 35%
Total net revenue ........................................ $4,515 $3,575 $940 26%
Product Revenue
For fiscal year 2015, product revenue was $2,568 million, primarily driven by FIFA 15,FIFA 14 and Battlefield
4. Product revenue increased $434 million, or 20 percent, as compared to fiscal year 2014. This increase was
driven by an $837 million increase primarily from the FIFA, Madden NFL and Dragon Age franchises. This
increase was partially offset by a $403 million decrease primarily from the Crysis, Dead Space, NCAA Football,
Tiger Woods PGA Tour and Army of Two franchises.
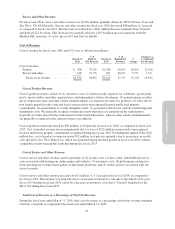
Service and Other Revenue
For fiscal year 2015, service and other revenue was $1,947 million, primarily driven by FIFA Ultimate Team,
Titanfall, and Battlefield 4 Premium. Service and other revenue for fiscal year 2015 increased $506 million, or 35
percent, as compared to fiscal year 2014. This increase was driven by a $660 million increase primarily from
Titanfall and the FIFA and Plants vs Zombies franchises. This increase was partially offset by a $154 million
decrease primarily from SimCity franchise, Star Wars: The Old Republic, and Pogo-branded online games
services.
38