Electronic Arts 2016 Annual Report Download - page 35
Download and view the complete annual report
Please find page 35 of the 2016 Electronic Arts annual report below. You can navigate through the pages in the report by either clicking on the pages listed below, or by using the keyword search tool below to find specific information within the annual report.-
 1
1 -
2
-
3
-
4
-
5
-
6
-
7
-
8
-
9
-
10
-
11
-
12
-
13
-
14
-
15
-
16
-
17
-
18
-
19
-
20
-
21
-
22
-
23
-
24
-
 25
25 -
 26
26 -
 27
27 -
 28
28 -
 29
29 -
 30
30 -
 31
31 -
 32
32 -
 33
33 -
 34
34 -
 35
35 -
 36
36 -
 37
37 -
 38
38 -
 39
39 -
 40
40 -
 41
41 -
 42
42 -
 43
43 -
 44
44 -
 45
45 -
46
-
47
-
48
-
49
-
50
-
51
-
52
-
53
-
54
-
55
-
56
-
57
-
58
-
59
-
60
-
61
-
62
-
63
-
64
-
65
-
66
-
67
-
68
-
69
-
70
-
71
-
72
-
73
-
74
-
75
-
76
-
77
-
78
-
79
-
80
-
81
-
82
-
83
-
84
-
85
-
86
-
87
-
88
-
89
-
90
-
91
-
92
-
93
-
94
-
95
-
96
-
97
-
98
-
99
-
100
-
101
-
102
-
103
-
104
-
105
-
106
-
107
-
108
-
109
-
110
-
111
-
112
-
113
-
114
-
115
-
116
-
117
-
118
-
119
-
120
-
121
-
122
-
123
-
124
-
125
-
126
-
127
-
128
-
129
-
130
-
131
-
132
-
133
-
134
-
135
-
136
-
137
-
138
-
139
-
140
-
141
-
142
-
143
-
144
-
145
-
146
-
147
-
148
-
149
-
150
-
151
-
152
-
153
-
154
-
155
-
156
-
157
-
158
-
159
-
160
-
161
-
162
-
163
-
164
-
165
-
166
-
167
-
168
-
169
-
170
-
171
-
172
-
173
-
174
-
175
-
176
-
177
-
178
-
179
-
180
-
181
-
182
-
183
-
184
-
185
-
186
-
187
-
188
 |
 |

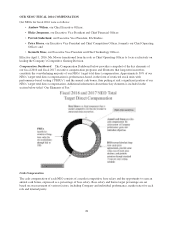
Proxy Statement
financial performance and expected growth rates. In the third quarter of fiscal 2015 (November 2014), the
Compensation Committee selected the following peer group to use as a reference for fiscal 2016 compensation
decisions.
FISCAL 2016 PEER GROUP
Video Game Technology/Internet Entertainment Toys/Games
Activision Blizzard Adobe Systems AMC Networks Inc. Hasbro
Zynga Autodesk Discovery Communications Mattel
Expedia Lions Gate Entertainment
IAC/Interactive Corp.
Intuit
LinkedIn Corporation
Priceline
Salesforce.com
Symantec
Yahoo!
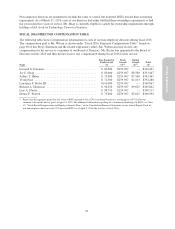
In the third quarter of fiscal 2016 (November 2015), the Compensation Committee assessed this peer group for
use in benchmarking fiscal 2017 compensation decisions and added eBay Inc. (“eBay”) to our peer group. We
regularly compete with eBay for talent (e.g., our Executive Vice President and Chief Technology Officer
Kenneth Moss joined us from eBay) and following the spin-off of the PayPal business, eBay’s revenues have
become more comparable to ours. The Compensation Committee determined no other changes were needed to
our peer group for fiscal 2017. Based on public filings through May 27, 2016, with respect to comparable
revenues we ranked in the 42nd percentile relative to our peer group as of the most recently completed fiscal year
of each respective company. As of May 27, 2016, our market capitalization ranked in the 58th percentile relative
to our peer group.
Compensation Benchmarking and the Role of Consultants
In February 2016, Compensia conducted a comprehensive analysis of our executive compensation programs
using publicly available compensation information on our peer group and data from the Radford Global
Technology Survey. The analysis included a comparison of the base salary, target cash compensation, long-term
incentives and target total direct compensation of each of our senior vice-president level positions and above
against similar positions in our peer group. Where sufficient market data for our peer group was not available,
Compensia used data from a broader group of similarly sized technology companies. Compensia provided the
Compensation Committee with its findings in February 2016 to be used as a reference for making bonus
decisions for fiscal 2016 and base salary and equity decisions for fiscal 2017.
Use of Percentiles
When setting the fiscal 2016 base salaries and bonus targets for our NEOs, the Compensation Committee
references the 50th to 75th percentiles of the market range of comparable companies, and for target guidelines for
annual equity awards, the Compensation Committee references the 75th percentile. We believe these percentiles
are appropriate to recruit and retain a strong leadership team in an industry and geographic area that is highly
competitive for executive talent. Our guidelines for annual equity awards reference a higher percentile because of
the important retention value of the awards. While we consider each component with respect to this data, the
actual base salary, bonus, and equity compensation awarded to an NEO may be above or below these targets and
is determined based on our financial performance, individual performance, market trends and other factors
unique to each individual.
The Compensation Committee also considers the aggregate value of all three target total direct compensation
components (i.e., base salary, bonus and annual equity awards), and references the 50th to 75th percentiles of the
market for target total direct compensation. When necessary for new hires, retention, succession planning, or
other factors, the Compensation Committee may approve compensation for select key executives that could
result in target total direct compensation above our referenced range.
27