Electronic Arts 2016 Annual Report Download - page 120
Download and view the complete annual report
Please find page 120 of the 2016 Electronic Arts annual report below. You can navigate through the pages in the report by either clicking on the pages listed below, or by using the keyword search tool below to find specific information within the annual report.-
 1
1 -
2
-
3
-
4
-
5
-
6
-
7
-
8
-
9
-
10
-
11
-
12
-
13
-
14
-
15
-
16
-
17
-
18
-
19
-
20
-
21
-
22
-
23
-
24
-
25
-
26
-
27
-
28
-
29
-
30
-
31
-
32
-
33
-
34
-
35
-
36
-
37
-
38
-
39
-
40
-
41
-
42
-
43
-
44
-
45
-
46
-
47
-
48
-
49
-
50
-
51
-
52
-
53
-
54
-
55
-
56
-
57
-
58
-
59
-
60
-
61
-
62
-
63
-
64
-
65
-
66
-
67
-
68
-
69
-
70
-
71
-
72
-
73
-
74
-
75
-
76
-
77
-
78
-
79
-
80
-
81
-
82
-
83
-
84
-
85
-
86
-
87
-
88
-
89
-
90
-
91
-
92
-
93
-
94
-
95
-
96
-
97
-
98
-
99
-
100
-
101
-
102
-
103
-
104
-
105
-
106
-
107
-
108
-
109
-
 110
110 -
 111
111 -
 112
112 -
 113
113 -
 114
114 -
 115
115 -
 116
116 -
 117
117 -
 118
118 -
 119
119 -
 120
120 -
 121
121 -
 122
122 -
 123
123 -
 124
124 -
 125
125 -
 126
126 -
 127
127 -
 128
128 -
 129
129 -
 130
130 -
131
-
132
-
133
-
134
-
135
-
136
-
137
-
138
-
139
-
140
-
141
-
142
-
143
-
144
-
145
-
146
-
147
-
148
-
149
-
150
-
151
-
152
-
153
-
154
-
155
-
156
-
157
-
158
-
159
-
160
-
161
-
162
-
163
-
164
-
165
-
166
-
167
-
168
-
169
-
170
-
171
-
172
-
173
-
174
-
175
-
176
-
177
-
178
-
179
-
180
-
181
-
182
-
183
-
184
-
185
-
186
-
187
-
188
 |
 |

balance sheet and disclosing key information about leasing arrangements. The updated guidance is effective for
annual periods beginning after December 15, 2018, including interim periods within those fiscal years. Early
adoption of the update is permitted. We are currently evaluating the timing of adoption and impact of this new
standard on our Consolidated Financial Statements and related disclosures.
RESULTS OF OPERATIONS
Our fiscal year is reported on a 52- or 53-week period that ends on the Saturday nearest March 31. Our results of
operations for the fiscal year ended March 31, 2016 contained 53 weeks and ended on April 2, 2016. Our results
of operations for the fiscal years ended March 31, 2015 and 2014 each contained 52 weeks and ended on
March 28, 2015 and March 29, 2014, respectively. For simplicity of disclosure, all fiscal periods are referred to
as ending on a calendar month-end.
Net Revenue
Net revenue consists of sales generated from (1) video games sold as packaged goods or as digital downloads and
designed for play on consoles (such as the PlayStation from Sony and the Xbox from Microsoft) and PCs,
(2) video games for mobile phones and tablets, (3) separate software products and content and online game
services associated with these products, (4) licensing our game software to third parties, (5) allowing other
companies to manufacture and sell our products in conjunction with other products, and (6) advertisements on
our online web pages and in our games.
Comparison of Fiscal Year 2016 to Fiscal Year 2015
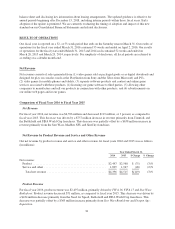
Net Revenue
For fiscal year 2016, net revenue was $4,396 million and decreased $119 million, or 3 percent, as compared to
fiscal year 2015. This decrease was driven by a $757 million decrease in revenue primarily from Titanfall, and
the Battlefield and FIFA World Cup franchises. This decrease was partially offset by a $638 million increase in
revenue primarily from the Star Wars, Madden NFL and SimCity franchises.
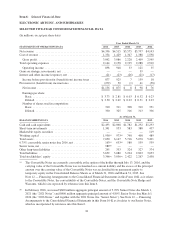
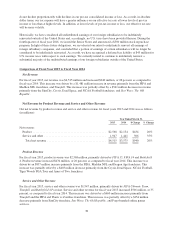
Net Revenue by Product Revenue and Service and Other Revenue
Our net revenue by product revenue and service and other revenue for fiscal years 2016 and 2015 was as follows
(in millions):
Year Ended March 31,
2016 2015 $ Change % Change
Net revenue:
Product .................................................. $2,497 $2,568 $ (71) (3)%
Service and other .......................................... 1,899 1,947 (48) (2)%
Total net revenue ........................................ $4,396 $4,515 $(119) (3)%
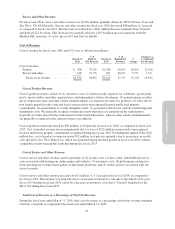
Product Revenue
For fiscal year 2016, product revenue was $2,497 million, primarily driven by FIFA 16,FIFA 15 and Star Wars
Battlefront. Product revenue decreased $71 million, as compared to fiscal year 2015. This decrease was driven by
a $434 million decrease primarily from the Need for Speed, Battlefield and FIFA World Cup franchises. This
decrease was partially offset by a $363 million increase primarily from Star Wars Battlefront and Dragon Age:
Inquisition.
34