Electronic Arts 2016 Annual Report Download - page 172
Download and view the complete annual report
Please find page 172 of the 2016 Electronic Arts annual report below. You can navigate through the pages in the report by either clicking on the pages listed below, or by using the keyword search tool below to find specific information within the annual report.-
 1
1 -
2
-
3
-
4
-
5
-
6
-
7
-
8
-
9
-
10
-
11
-
12
-
13
-
14
-
15
-
16
-
17
-
18
-
19
-
20
-
21
-
22
-
23
-
24
-
25
-
26
-
27
-
28
-
29
-
30
-
31
-
32
-
33
-
34
-
35
-
36
-
37
-
38
-
39
-
40
-
41
-
42
-
43
-
44
-
45
-
46
-
47
-
48
-
49
-
50
-
51
-
52
-
53
-
54
-
55
-
56
-
57
-
58
-
59
-
60
-
61
-
62
-
63
-
64
-
65
-
66
-
67
-
68
-
69
-
70
-
71
-
72
-
73
-
74
-
75
-
76
-
77
-
78
-
79
-
80
-
81
-
82
-
83
-
84
-
85
-
86
-
87
-
88
-
89
-
90
-
91
-
92
-
93
-
94
-
95
-
96
-
97
-
98
-
99
-
100
-
101
-
102
-
103
-
104
-
105
-
106
-
107
-
108
-
109
-
110
-
111
-
112
-
113
-
114
-
115
-
116
-
117
-
118
-
119
-
120
-
121
-
122
-
123
-
124
-
125
-
126
-
127
-
128
-
129
-
130
-
131
-
132
-
133
-
134
-
135
-
136
-
137
-
138
-
139
-
140
-
141
-
142
-
143
-
144
-
145
-
146
-
147
-
148
-
149
-
150
-
151
-
152
-
153
-
154
-
155
-
156
-
157
-
158
-
159
-
160
-
161
-
 162
162 -
 163
163 -
 164
164 -
 165
165 -
 166
166 -
 167
167 -
 168
168 -
 169
169 -
 170
170 -
 171
171 -
 172
172 -
 173
173 -
 174
174 -
 175
175 -
 176
176 -
 177
177 -
 178
178 -
 179
179 -
 180
180 -
 181
181 -
 182
182 -
183
-
184
-
185
-
186
-
187
-
188
 |
 |

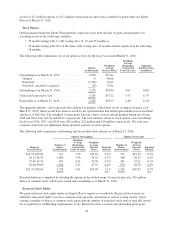
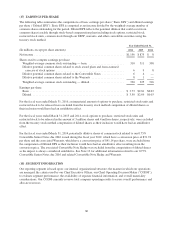
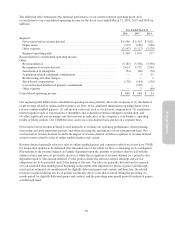
(17) EARNINGS PER SHARE
The following table summarizes the computations of basic earnings per share (“Basic EPS”) and diluted earnings
per share (“Diluted EPS”). Basic EPS is computed as net income divided by the weighted-average number of
common shares outstanding for the period. Diluted EPS reflects the potential dilution that could occur from
common shares issuable through stock-based compensation plans including stock options, restricted stock,
restricted stock units, common stock through our ESPP, warrants, and other convertible securities using the
treasury stock method.
Year Ended March 31,
(In millions, except per share amounts) 2016 2015 2014
Net income ............................................................. $1,156 $ 875 $ 8
Shares used to compute earnings per share:
Weighted-average common stock outstanding — basic ........................ 310 311 308
Dilutive potential common shares related to stock award plans and from assumed
exercise of stock options .............................................. 6 9 8
Dilutive potential common shares related to the Convertible Notes ............... 6 4 —
Dilutive potential common shares related to the Warrants ...................... 8 1 —
Weighted-average common stock outstanding — diluted ....................... 330 325 316
Earnings per share:
Basic ................................................................ $ 3.73 $2.81 $0.03
Diluted .............................................................. $ 3.50 $2.69 $0.03
For the fiscal year ended March 31, 2016, an immaterial amount of options to purchase, restricted stock units and
restricted stock to be released were excluded from the treasury stock method computation of diluted shares as
their inclusion would have had an antidilutive effect.
For the fiscal years ended March 31, 2015 and 2014, stock options to purchase, restricted stock units and
restricted stock to be released in the amount of 3 million shares and 4 million shares, respectively, were excluded
from the treasury stock method computation of diluted shares as their inclusion would have had an antidilutive
effect.
For the fiscal year ended March 31, 2014, potentially dilutive shares of common stock related to our 0.75%
Convertible Senior Notes due 2016 issued during the fiscal year 2012, which have a conversion price of $31.74
per share and the associated Warrants, which have a conversion price of $41.14 per share, were excluded from
the computation of Diluted EPS as their inclusion would have had an antidilutive effect resulting from the
conversion price. The associated Convertible Note Hedge was excluded from the computation of diluted shares
as the impact is always considered antidilutive. See Note 12 for additional information related to our 0.75%
Convertible Senior Notes due 2016 and related Convertible Note Hedge and Warrants.
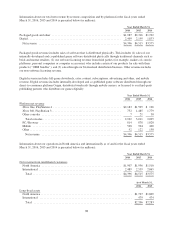
(18) SEGMENT INFORMATION
Our reporting segment is based upon: our internal organizational structure; the manner in which our operations
are managed; the criteria used by our Chief Executive Officer, our Chief Operating Decision Maker (“CODM”),
to evaluate segment performance; the availability of separate financial information; and overall materiality
considerations. Our CODM currently reviews total company operating results to assess overall performance and
allocate resources.
86