Electronic Arts 2016 Annual Report Download - page 109
Download and view the complete annual report
Please find page 109 of the 2016 Electronic Arts annual report below. You can navigate through the pages in the report by either clicking on the pages listed below, or by using the keyword search tool below to find specific information within the annual report.-
 1
1 -
2
-
3
-
4
-
5
-
6
-
7
-
8
-
9
-
10
-
11
-
12
-
13
-
14
-
15
-
16
-
17
-
18
-
19
-
20
-
21
-
22
-
23
-
24
-
25
-
26
-
27
-
28
-
29
-
30
-
31
-
32
-
33
-
34
-
35
-
36
-
37
-
38
-
39
-
40
-
41
-
42
-
43
-
44
-
45
-
46
-
47
-
48
-
49
-
50
-
51
-
52
-
53
-
54
-
55
-
56
-
57
-
58
-
59
-
60
-
61
-
62
-
63
-
64
-
65
-
66
-
67
-
68
-
69
-
70
-
71
-
72
-
73
-
74
-
75
-
76
-
77
-
78
-
79
-
80
-
81
-
82
-
83
-
84
-
85
-
86
-
87
-
88
-
89
-
90
-
91
-
92
-
93
-
94
-
95
-
96
-
97
-
98
-
 99
99 -
 100
100 -
 101
101 -
 102
102 -
 103
103 -
 104
104 -
 105
105 -
 106
106 -
 107
107 -
 108
108 -
 109
109 -
 110
110 -
 111
111 -
 112
112 -
 113
113 -
 114
114 -
 115
115 -
 116
116 -
 117
117 -
 118
118 -
 119
119 -
120
-
121
-
122
-
123
-
124
-
125
-
126
-
127
-
128
-
129
-
130
-
131
-
132
-
133
-
134
-
135
-
136
-
137
-
138
-
139
-
140
-
141
-
142
-
143
-
144
-
145
-
146
-
147
-
148
-
149
-
150
-
151
-
152
-
153
-
154
-
155
-
156
-
157
-
158
-
159
-
160
-
161
-
162
-
163
-
164
-
165
-
166
-
167
-
168
-
169
-
170
-
171
-
172
-
173
-
174
-
175
-
176
-
177
-
178
-
179
-
180
-
181
-
182
-
183
-
184
-
185
-
186
-
187
-
188
 |
 |
Annual Report
Stock Performance Graph
The following information shall not be deemed to be “filed” with the SEC nor shall this information be
incorporated by reference into any future filing under the Securities Act of 1933, as amended, or the Securities
Exchange Act of 1934, as amended, except to the extent that we specifically incorporate it by reference into a
filing.
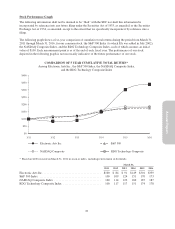
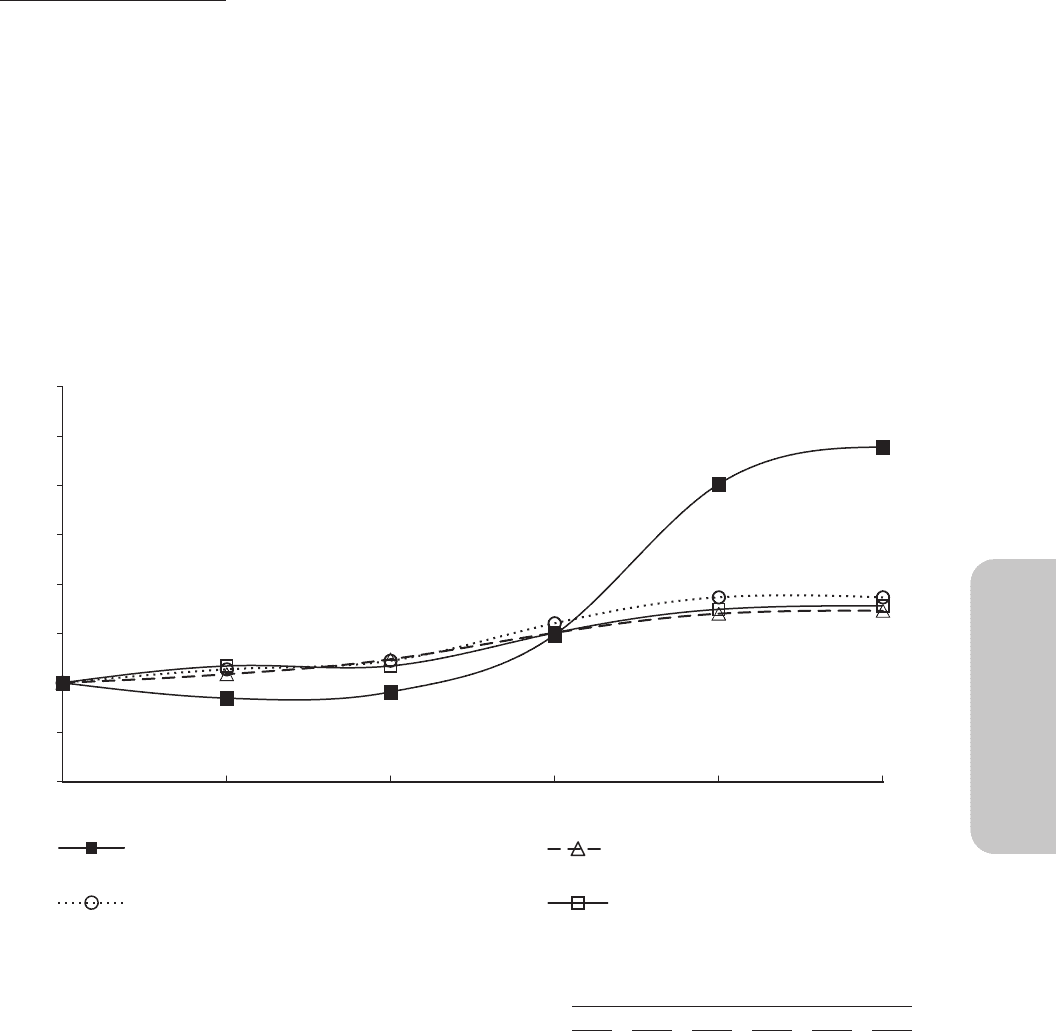
The following graph shows a five-year comparison of cumulative total returns during the period from March 31,
2011 through March 31, 2016, for our common stock, the S&P 500 Index (to which EA was added in July 2002),
the NASDAQ Composite Index, and the RDG Technology Composite Index, each of which assumes an initial
value of $100. Each measurement point is as of the end of each fiscal year. The performance of our stock
depicted in the following graph is not necessarily indicative of the future performance of our stock.
COMPARISON OF 5 YEAR CUMULATIVE TOTAL RETURN*
Among Electronic Arts Inc., the S&P 500 Index, the NASDAQ Composite Index,
and the RDG Technology Composite Index
$0
$50
$100
$150
$200
$250
$300
$400
$350
Electronic Arts Inc. S&P 500
NASDAQ Composite RDG Technology Composite
3/163/153/143/133/123/11
* Based on $100 invested on March 31, 2011 in stock or index, including reinvestment of dividends.
March 31,
2011 2012 2013 2014 2015 2016
Electronic Arts Inc. ....................................... $100 $ 84 $ 91 $149 $301 $339
S&P 500 Index .......................................... 100 109 124 151 170 173
NASDAQ Composite Index ................................ 100 114 122 160 187 187
RDG Technology Composite Index .......................... 100 117 117 151 174 178
23