Electronic Arts 2016 Annual Report Download - page 168
Download and view the complete annual report
Please find page 168 of the 2016 Electronic Arts annual report below. You can navigate through the pages in the report by either clicking on the pages listed below, or by using the keyword search tool below to find specific information within the annual report.-
 1
1 -
2
-
3
-
4
-
5
-
6
-
7
-
8
-
9
-
10
-
11
-
12
-
13
-
14
-
15
-
16
-
17
-
18
-
19
-
20
-
21
-
22
-
23
-
24
-
25
-
26
-
27
-
28
-
29
-
30
-
31
-
32
-
33
-
34
-
35
-
36
-
37
-
38
-
39
-
40
-
41
-
42
-
43
-
44
-
45
-
46
-
47
-
48
-
49
-
50
-
51
-
52
-
53
-
54
-
55
-
56
-
57
-
58
-
59
-
60
-
61
-
62
-
63
-
64
-
65
-
66
-
67
-
68
-
69
-
70
-
71
-
72
-
73
-
74
-
75
-
76
-
77
-
78
-
79
-
80
-
81
-
82
-
83
-
84
-
85
-
86
-
87
-
88
-
89
-
90
-
91
-
92
-
93
-
94
-
95
-
96
-
97
-
98
-
99
-
100
-
101
-
102
-
103
-
104
-
105
-
106
-
107
-
108
-
109
-
110
-
111
-
112
-
113
-
114
-
115
-
116
-
117
-
118
-
119
-
120
-
121
-
122
-
123
-
124
-
125
-
126
-
127
-
128
-
129
-
130
-
131
-
132
-
133
-
134
-
135
-
136
-
137
-
138
-
139
-
140
-
141
-
142
-
143
-
144
-
145
-
146
-
147
-
148
-
149
-
150
-
151
-
152
-
153
-
154
-
155
-
156
-
157
-
 158
158 -
 159
159 -
 160
160 -
 161
161 -
 162
162 -
 163
163 -
 164
164 -
 165
165 -
 166
166 -
 167
167 -
 168
168 -
 169
169 -
 170
170 -
 171
171 -
 172
172 -
 173
173 -
 174
174 -
 175
175 -
 176
176 -
 177
177 -
 178
178 -
179
-
180
-
181
-
182
-
183
-
184
-
185
-
186
-
187
-
188
 |
 |

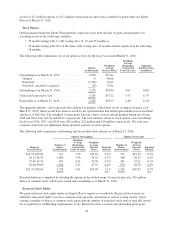
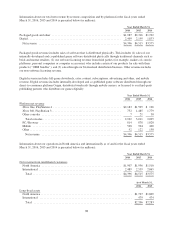
A total of 15.2 million options or 10.7 million restricted stock units were available for grant under our Equity
Plan as of March 31, 2016.
Stock Options
Options granted under the Equity Plan generally expire ten years from the date of grant and generally vest
according to one of the following schedules:
• 35 month vesting with
1
⁄
3
cliff vesting after 11, 23 and 35 months or;
• 50 month vesting with 24% of the shares cliff vesting after 12 months and the ratably over the following
38 months.
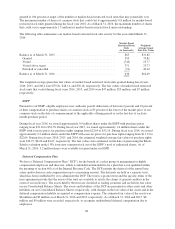
The following table summarizes our stock option activity for the fiscal year ended March 31, 2016:
Options
(in thousands)
Weighted-
Average
Exercise Prices
Weighted-
Average
Remaining
Contractual
Term (in years)
Aggregate
Intrinsic Value
(in millions)
Outstanding as of March 31, 2015 .............. 4,920 $37.44
Granted ................................. 6 66.08
Exercised ................................ (1,594) 42.43
Forfeited, cancelled or expired ............... (54) 35.61
Outstanding as of March 31, 2016 .............. 3,278 $35.09 5.61 $101
Vested and expected to vest ................... 3,163 $35.22 5.53 $ 97
Exercisable as of March 31, 2016 ............... 2,206 $36.55 4.46 $ 65
The aggregate intrinsic value represents the total pre-tax intrinsic value based on our closing stock price as of
March 31, 2016, which would have been received by the option holders had all the option holders exercised their
options as of that date. The weighted-average grant date fair values of stock options granted during fiscal years
2015 and 2014 were $12.01 and $8.61, respectively. The total intrinsic values of stock options exercised during
fiscal years 2016, 2015, and 2014 were $38 million, $22 million and $16 million, respectively. We issue new
common stock from our authorized shares upon the exercise of stock options.
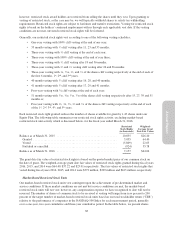
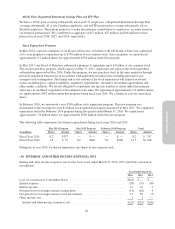
The following table summarizes outstanding and exercisable stock options as of March 31, 2016:
Options Outstanding Options Exercisable
Range of
Exercise Prices
Number of
Shares
(in thousands)
Weighted-
Average
Remaining
Contractual
Term (in years)
Weighted-
Average
Exercise
Prices
Potential
Dilution
Number of
Shares
(in thousands)
Weighted-
Average
Exercise
Prices
Potential
Dilution
$11.53-$23.83 317 3.39 $19.10 0.1% 313 $19.18 0.1%
26.25-26.25 1,000 7.58 26.25 0.3% 580 26.25 0.2%
27.49-35.70 853 8.21 35.50 0.3% 343 35.21 0.1%
36.00-59.63 1,108 2.47 47.33 0.4% 970 48.78 0.3%
$11.53-$59.63 3,278 5.61 $35.09 1.1% 2,206 $36.55 0.7%
Potential dilution is computed by dividing the options in the related range of exercise prices by 301 million
shares of common stock, which were issued and outstanding as of March 31, 2016.
Restricted Stock Rights
We grant restricted stock rights under our Equity Plan to employees worldwide. Restricted stock units are
unfunded, unsecured rights to receive common stock upon the satisfaction of certain vesting criteria. Upon
vesting, a number of shares of common stock equivalent the number of restricted stock units is typically issued
net of required tax withholding requirements, if any. Restricted stock is issued and outstanding upon grant;
82