Electronic Arts 2016 Annual Report Download - page 175
Download and view the complete annual report
Please find page 175 of the 2016 Electronic Arts annual report below. You can navigate through the pages in the report by either clicking on the pages listed below, or by using the keyword search tool below to find specific information within the annual report.-
 1
1 -
2
-
3
-
4
-
5
-
6
-
7
-
8
-
9
-
10
-
11
-
12
-
13
-
14
-
15
-
16
-
17
-
18
-
19
-
20
-
21
-
22
-
23
-
24
-
25
-
26
-
27
-
28
-
29
-
30
-
31
-
32
-
33
-
34
-
35
-
36
-
37
-
38
-
39
-
40
-
41
-
42
-
43
-
44
-
45
-
46
-
47
-
48
-
49
-
50
-
51
-
52
-
53
-
54
-
55
-
56
-
57
-
58
-
59
-
60
-
61
-
62
-
63
-
64
-
65
-
66
-
67
-
68
-
69
-
70
-
71
-
72
-
73
-
74
-
75
-
76
-
77
-
78
-
79
-
80
-
81
-
82
-
83
-
84
-
85
-
86
-
87
-
88
-
89
-
90
-
91
-
92
-
93
-
94
-
95
-
96
-
97
-
98
-
99
-
100
-
101
-
102
-
103
-
104
-
105
-
106
-
107
-
108
-
109
-
110
-
111
-
112
-
113
-
114
-
115
-
116
-
117
-
118
-
119
-
120
-
121
-
122
-
123
-
124
-
125
-
126
-
127
-
128
-
129
-
130
-
131
-
132
-
133
-
134
-
135
-
136
-
137
-
138
-
139
-
140
-
141
-
142
-
143
-
144
-
145
-
146
-
147
-
148
-
149
-
150
-
151
-
152
-
153
-
154
-
155
-
156
-
157
-
158
-
159
-
160
-
161
-
162
-
163
-
164
-
 165
165 -
 166
166 -
 167
167 -
 168
168 -
 169
169 -
 170
170 -
 171
171 -
 172
172 -
 173
173 -
 174
174 -
 175
175 -
 176
176 -
 177
177 -
 178
178 -
 179
179 -
 180
180 -
 181
181 -
 182
182 -
 183
183 -
 184
184 -
 185
185 -
186
-
187
-
188
 |
 |

Annual Report
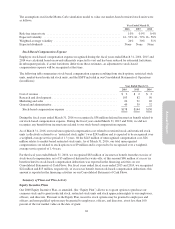
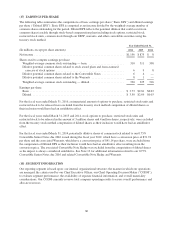
We attribute net revenue from external customers to individual countries based on the location of the legal entity
that sells the products and/or services. Note that revenue attributed to the legal entity that makes the sale is often
not the country where the consumer resides. For example, revenue generated by our Swiss legal entities includes
digital revenue from consumers who reside outside of Switzerland, including consumers who reside outside of
Europe. Revenue generated by our Swiss legal entities during fiscal years 2016, 2015, and 2014 represents
$1,643 million, $1,462 million and $1,171 million or 37 percent, 32 percent and 33 percent of our total net
revenue, respectively. Revenue generated in the United States represents over 99 percent of our total North
America net revenue. There were no other countries with net revenue greater than 10 percent.
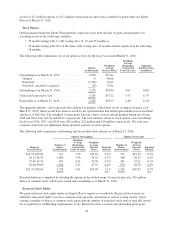
In fiscal year 2016, our direct sales to Sony and Microsoft represented approximately 16 percent and 14 percent
of total net revenue, respectively. In fiscal year 2015, our direct sales to Microsoft represented approximately 10
percent of total net revenue. Our direct sales to GameStop Corp. represented approximately 11 percent, and 13
percent of total net revenue in fiscal years 2015 and 2014, respectively.
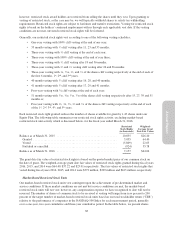
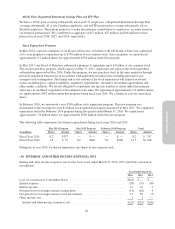
(19) QUARTERLY FINANCIAL AND MARKET INFORMATION (UNAUDITED)
Quarter Ended Year
Ended(In millions, except per share data) June 30 September 30 December 31 March 31
Fiscal 2016 Consolidated
Net revenue ................................... $1,203 $ 815 $1,070 $1,308 $4,396
Gross profit ................................... 1,030 406 524 1,082 3,042
Operating income (loss) ......................... 512 (119) (31) 536 898
Net income (loss) ............................... 442 (140) (45) 899(a) 1,156
Common Stock
Earnings (loss) per share — Basic ................. $ 1.42 $ (0.45) $ (0.14) $ 2.93 $ 3.73
Earnings (loss) per share — Diluted ................ $ 1.32 $ (0.45) $ (0.14) $ 2.79 $ 3.50
Common stock price per share
High ....................................... $68.00 $75.16 $76.77 $70.83 $76.77
Low ....................................... $56.03 $63.43 $65.04 $55.50 $55.50
Fiscal 2015 Consolidated
Net revenue ................................... $1,214 $ 990 $1,126 $1,185 $4,515
Gross profit ................................... 847 563 725 951 3,086
Operating income .............................. 362 24 162 400 948
Net income ................................... 335 3 142 395 875
Common Stock
Earnings per share — Basic ...................... $ 1.07 $ 0.01 $ 0.46 $ 1.27 $ 2.81
Earnings per share — Diluted ..................... $ 1.04 $ 0.01 $ 0.44 $ 1.19 $ 2.69
Common stock price per share
High ....................................... $37.15 $38.42 $48.33 $58.24 $58.24
Low ....................................... $26.67 $33.31 $32.62 $45.96 $26.67
(a) Net income includes an income tax benefit recorded in the fourth quarter of fiscal year 2016 for the reversal
of a significant portion of our deferred tax valuation allowance.
Our common stock is traded on the NASDAQ Global Select Market under the symbol “EA”. The prices for the
common stock in the table above represent the high and low closing sales prices as reported on the NASDAQ
Global Select Market.
89