Electronic Arts 2016 Annual Report Download - page 134
Download and view the complete annual report
Please find page 134 of the 2016 Electronic Arts annual report below. You can navigate through the pages in the report by either clicking on the pages listed below, or by using the keyword search tool below to find specific information within the annual report.-
 1
1 -
2
-
3
-
4
-
5
-
6
-
7
-
8
-
9
-
10
-
11
-
12
-
13
-
14
-
15
-
16
-
17
-
18
-
19
-
20
-
21
-
22
-
23
-
24
-
25
-
26
-
27
-
28
-
29
-
30
-
31
-
32
-
33
-
34
-
35
-
36
-
37
-
38
-
39
-
40
-
41
-
42
-
43
-
44
-
45
-
46
-
47
-
48
-
49
-
50
-
51
-
52
-
53
-
54
-
55
-
56
-
57
-
58
-
59
-
60
-
61
-
62
-
63
-
64
-
65
-
66
-
67
-
68
-
69
-
70
-
71
-
72
-
73
-
74
-
75
-
76
-
77
-
78
-
79
-
80
-
81
-
82
-
83
-
84
-
85
-
86
-
87
-
88
-
89
-
90
-
91
-
92
-
93
-
94
-
95
-
96
-
97
-
98
-
99
-
100
-
101
-
102
-
103
-
104
-
105
-
106
-
107
-
108
-
109
-
110
-
111
-
112
-
113
-
114
-
115
-
116
-
117
-
118
-
119
-
120
-
121
-
122
-
123
-
 124
124 -
 125
125 -
 126
126 -
 127
127 -
 128
128 -
 129
129 -
 130
130 -
 131
131 -
 132
132 -
 133
133 -
 134
134 -
 135
135 -
 136
136 -
 137
137 -
 138
138 -
 139
139 -
 140
140 -
 141
141 -
 142
142 -
 143
143 -
 144
144 -
145
-
146
-
147
-
148
-
149
-
150
-
151
-
152
-
153
-
154
-
155
-
156
-
157
-
158
-
159
-
160
-
161
-
162
-
163
-
164
-
165
-
166
-
167
-
168
-
169
-
170
-
171
-
172
-
173
-
174
-
175
-
176
-
177
-
178
-
179
-
180
-
181
-
182
-
183
-
184
-
185
-
186
-
187
-
188
 |
 |

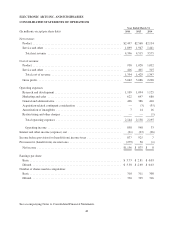
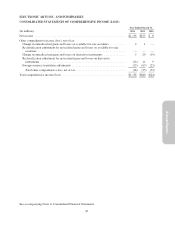
ELECTRONIC ARTS INC. AND SUBSIDIARIES
CONSOLIDATED STATEMENTS OF OPERATIONS
Year Ended March 31,
(In millions, except per share data) 2016 2015 2014
Net revenue:
Product ............................................................ $2,497 $2,568 $2,134
Service and other .................................................... 1,899 1,947 1,441
Total net revenue .................................................. 4,396 4,515 3,575
Cost of revenue:
Product ............................................................ 938 1,028 1,032
Service and other .................................................... 416 401 315
Total cost of revenue ............................................... 1,354 1,429 1,347
Gross profit ......................................................... 3,042 3,086 2,228
Operating expenses:
Research and development ............................................. 1,109 1,094 1,125
Marketing and sales .................................................. 622 647 680
General and administrative ............................................ 406 386 410
Acquisition-related contingent consideration .............................. — (3) (35)
Amortization of intangibles ............................................ 7 14 16
Restructuring and other charges ......................................... — — (1)
Total operating expenses ............................................ 2,144 2,138 2,195
Operating income .................................................. 898 948 33
Interest and other income (expense), net .................................... (21) (23) (26)
Income before provision for (benefit from) income taxes ....................... 877 925 7
Provision for (benefit from) income taxes ................................... (279) 50 (1)
Net income ......................................................... $1,156 $ 875 $ 8
Earnings per share:
Basic .............................................................. $ 3.73 $ 2.81 $ 0.03
Diluted ............................................................ $ 3.50 $ 2.69 $ 0.03
Number of shares used in computation:
Basic .............................................................. 310 311 308
Diluted ............................................................ 330 325 316
See accompanying Notes to Consolidated Financial Statements.
48