Electronic Arts 2016 Annual Report Download - page 126
Download and view the complete annual report
Please find page 126 of the 2016 Electronic Arts annual report below. You can navigate through the pages in the report by either clicking on the pages listed below, or by using the keyword search tool below to find specific information within the annual report.-
 1
1 -
2
-
3
-
4
-
5
-
6
-
7
-
8
-
9
-
10
-
11
-
12
-
13
-
14
-
15
-
16
-
17
-
18
-
19
-
20
-
21
-
22
-
23
-
24
-
25
-
26
-
27
-
28
-
29
-
30
-
31
-
32
-
33
-
34
-
35
-
36
-
37
-
38
-
39
-
40
-
41
-
42
-
43
-
44
-
45
-
46
-
47
-
48
-
49
-
50
-
51
-
52
-
53
-
54
-
55
-
56
-
57
-
58
-
59
-
60
-
61
-
62
-
63
-
64
-
65
-
66
-
67
-
68
-
69
-
70
-
71
-
72
-
73
-
74
-
75
-
76
-
77
-
78
-
79
-
80
-
81
-
82
-
83
-
84
-
85
-
86
-
87
-
88
-
89
-
90
-
91
-
92
-
93
-
94
-
95
-
96
-
97
-
98
-
99
-
100
-
101
-
102
-
103
-
104
-
105
-
106
-
107
-
108
-
109
-
110
-
111
-
112
-
113
-
114
-
115
-
 116
116 -
 117
117 -
 118
118 -
 119
119 -
 120
120 -
 121
121 -
 122
122 -
 123
123 -
 124
124 -
 125
125 -
 126
126 -
 127
127 -
 128
128 -
 129
129 -
 130
130 -
 131
131 -
 132
132 -
 133
133 -
 134
134 -
 135
135 -
 136
136 -
137
-
138
-
139
-
140
-
141
-
142
-
143
-
144
-
145
-
146
-
147
-
148
-
149
-
150
-
151
-
152
-
153
-
154
-
155
-
156
-
157
-
158
-
159
-
160
-
161
-
162
-
163
-
164
-
165
-
166
-
167
-
168
-
169
-
170
-
171
-
172
-
173
-
174
-
175
-
176
-
177
-
178
-
179
-
180
-
181
-
182
-
183
-
184
-
185
-
186
-
187
-
188
 |
 |

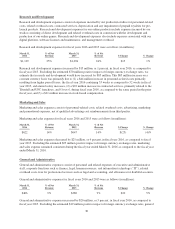
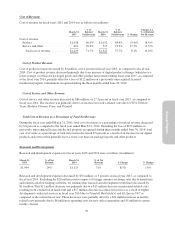
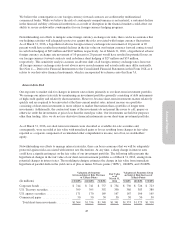
Marketing and Sales
Marketing and sales expenses for fiscal years 2015 and 2014 were as follows (in millions):
March 31,
2015
% of Net
Revenue
March 31,
2014
% of Net
Revenue $ Change % Change
$647 14% $680 19% $(33) (5)%
Marketing and sales expenses decreased by $33 million, or 5 percent, in fiscal year 2015, as compared to fiscal
year 2014. The decrease was primarily due to (1) a $9 million decrease in personnel-related costs, (2) a $10
million decrease in facility-related costs, and (3) a $9 million decrease in contracted services due to fewer
frontline title releases during fiscal year 2015 than during fiscal year 2014.
General and Administrative
General and administrative expenses for fiscal years 2015 and 2014 were as follows (in millions):
March 31,
2015
% of Net
Revenue
March 31,
2014
% of Net
Revenue $ Change % Change
$386 9% $410 11% $(24) (6)%
General and administrative expenses decreased by $24 million, or 6 percent, in fiscal year 2015, as compared to
fiscal year 2014, primarily due to a $30 million expense related to the settlement of a litigation matter during the
fiscal year ended March 31, 2014 and an $23 million decrease in costs incurred on a license, both related to our
college football franchise. This was partially offset by an $11 million increase primarily related to other litigation
matters and a $16 million increase in personnel-related costs during the fiscal year ended March 31, 2015.
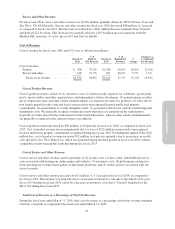
Acquisition-Related Contingent Consideration
Acquisition-related contingent consideration for fiscal years 2015 and 2014 were as follows (in millions):
March 31,
2015
% of Net
Revenue
March 31,
2014
% of Net
Revenue $ Change % Change
(3) —% (35) (1)% $32 91%
During fiscal year 2015, acquisition-related contingent consideration credits decreased by $32 million, or 91
percent, as compared to fiscal year 2014, primarily resulting from changes in the fair market value of the
acquisition-related contingent consideration of our PopCap acquisition during fiscal year 2014. The PopCap
earn-out expired on December 31, 2013. No payments were made under this earn-out.
Income Taxes
Provision for (benefit from) income taxes for fiscal years 2015 and 2014 was as follows (in millions):
March 31,
2015
Effective
Tax
Rate
March 31,
2014
Effective
Tax Rate
$50 5.4% $(1) (14.3)%
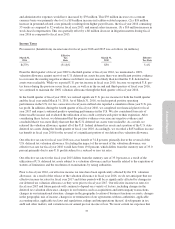
Our effective tax rate for fiscal year 2015 was a tax expense of 5.4 percent. The fiscal year 2015 effective tax rate
differs from the statutory rate of 35.0 percent primarily due to the utilization of U.S. deferred tax assets, which
were subject to a valuation allowance, excess tax benefits from stock-based compensation deductions allocated
directly to contributed capital, and non- U.S. profits subject to a reduced or zero tax rates. The provision for
income taxes for fiscal year 2015 differs from the benefit from income taxes for fiscal year 2014 primarily due to
benefits related to the expiration of statutes of limitations and the resolution of examinations by taxing authorities
recorded in fiscal year 2014.
40