Electronic Arts 2016 Annual Report Download - page 122
Download and view the complete annual report
Please find page 122 of the 2016 Electronic Arts annual report below. You can navigate through the pages in the report by either clicking on the pages listed below, or by using the keyword search tool below to find specific information within the annual report.-
 1
1 -
2
-
3
-
4
-
5
-
6
-
7
-
8
-
9
-
10
-
11
-
12
-
13
-
14
-
15
-
16
-
17
-
18
-
19
-
20
-
21
-
22
-
23
-
24
-
25
-
26
-
27
-
28
-
29
-
30
-
31
-
32
-
33
-
34
-
35
-
36
-
37
-
38
-
39
-
40
-
41
-
42
-
43
-
44
-
45
-
46
-
47
-
48
-
49
-
50
-
51
-
52
-
53
-
54
-
55
-
56
-
57
-
58
-
59
-
60
-
61
-
62
-
63
-
64
-
65
-
66
-
67
-
68
-
69
-
70
-
71
-
72
-
73
-
74
-
75
-
76
-
77
-
78
-
79
-
80
-
81
-
82
-
83
-
84
-
85
-
86
-
87
-
88
-
89
-
90
-
91
-
92
-
93
-
94
-
95
-
96
-
97
-
98
-
99
-
100
-
101
-
102
-
103
-
104
-
105
-
106
-
107
-
108
-
109
-
110
-
111
-
 112
112 -
 113
113 -
 114
114 -
 115
115 -
 116
116 -
 117
117 -
 118
118 -
 119
119 -
 120
120 -
 121
121 -
 122
122 -
 123
123 -
 124
124 -
 125
125 -
 126
126 -
 127
127 -
 128
128 -
 129
129 -
 130
130 -
 131
131 -
 132
132 -
133
-
134
-
135
-
136
-
137
-
138
-
139
-
140
-
141
-
142
-
143
-
144
-
145
-
146
-
147
-
148
-
149
-
150
-
151
-
152
-
153
-
154
-
155
-
156
-
157
-
158
-
159
-
160
-
161
-
162
-
163
-
164
-
165
-
166
-
167
-
168
-
169
-
170
-
171
-
172
-
173
-
174
-
175
-
176
-
177
-
178
-
179
-
180
-
181
-
182
-
183
-
184
-
185
-
186
-
187
-
188
 |
 |

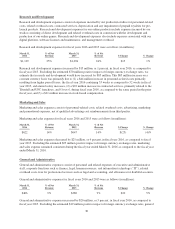
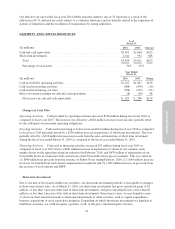
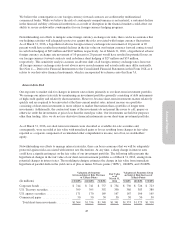
Research and Development
Research and development expenses consist of expenses incurred by our production studios for personnel-related
costs, related overhead costs, contracted services, depreciation and any impairment of prepaid royalties for pre-
launch products. Research and development expenses for our online products include expenses incurred by our
studios consisting of direct development and related overhead costs in connection with the development and
production of our online games. Research and development expenses also include expenses associated with our
digital platform, software licenses and maintenance, and management overhead.
Research and development expenses for fiscal years 2016 and 2015 were as follows (in millions):
March 31,
2016
% of Net
Revenue
March 31,
2015
% of Net
Revenue $ Change % Change
$1,109 25% $1,094 24% $15 1%
Research and development expenses increased by $15 million, or 1 percent, in fiscal year 2016, as compared to
fiscal year 2015. Excluding the estimated $70 million positive impact of foreign currency exchange rates, we
estimate that research and development would have increased by $85 million. This $85 million increase on a
constant currency basis was primarily due to (1) a $44 million increase in personnel-related costs primarily
resulting from higher payroll taxes, the fiscal year 2016 containing 53 weeks as compared to 52 weeks in fiscal
year 2015, and annual salary increases, (2) a $22 million increase in contracted services, primarily related to the
Titanfall and UFC franchises, and Unravel, during fiscal year 2016, as compared to the same period in the prior
fiscal year, and (3) a $21 million increase in stock-based compensation.
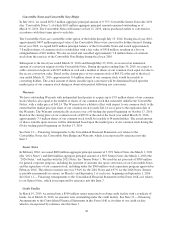
Marketing and Sales
Marketing and sales expenses consist of personnel-related costs, related overhead costs, advertising, marketing
and promotional expenses, net of qualified advertising cost reimbursements from third parties.
Marketing and sales expenses for fiscal years 2016 and 2015 were as follows (in millions):
March 31,
2016
% of Net
Revenue
March 31,
2015
% of Net
Revenue $ Change % Change
$622 14% $647 14% $(25) (4)%
Marketing and sales expenses decreased by $25 million, or 4 percent, in fiscal year 2016, as compared to fiscal
year 2015. Excluding the estimated $25 million positive impact of foreign currency exchange rates, marketing
and sales expense remained consistent during the fiscal year ended March 31, 2016 as compared to the fiscal year
ended March 31, 2016.
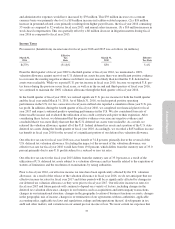
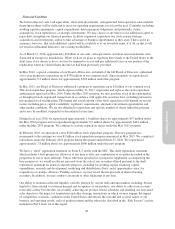
General and Administrative
General and administrative expenses consist of personnel and related expenses of executive and administrative
staff, corporate functions such as finance, legal, human resources, and information technology (“IT”), related
overhead costs, fees for professional services such as legal and accounting, and allowances for doubtful accounts.
General and administrative expenses for fiscal years 2016 and 2015 were as follows (in millions):
March 31,
2016
% of Net
Revenue
March 31,
2015
% of Net
Revenue $ Change % Change
$406 9% $386 9% $20 5%
General and administrative expenses increased by $20 million, or 5 percent, in fiscal year 2016, as compared to
fiscal year 2015. Excluding the estimated $19 million positive impact of foreign currency exchange rates, general
36