Electronic Arts 2016 Annual Report Download - page 131
Download and view the complete annual report
Please find page 131 of the 2016 Electronic Arts annual report below. You can navigate through the pages in the report by either clicking on the pages listed below, or by using the keyword search tool below to find specific information within the annual report.-
 1
1 -
2
-
3
-
4
-
5
-
6
-
7
-
8
-
9
-
10
-
11
-
12
-
13
-
14
-
15
-
16
-
17
-
18
-
19
-
20
-
21
-
22
-
23
-
24
-
25
-
26
-
27
-
28
-
29
-
30
-
31
-
32
-
33
-
34
-
35
-
36
-
37
-
38
-
39
-
40
-
41
-
42
-
43
-
44
-
45
-
46
-
47
-
48
-
49
-
50
-
51
-
52
-
53
-
54
-
55
-
56
-
57
-
58
-
59
-
60
-
61
-
62
-
63
-
64
-
65
-
66
-
67
-
68
-
69
-
70
-
71
-
72
-
73
-
74
-
75
-
76
-
77
-
78
-
79
-
80
-
81
-
82
-
83
-
84
-
85
-
86
-
87
-
88
-
89
-
90
-
91
-
92
-
93
-
94
-
95
-
96
-
97
-
98
-
99
-
100
-
101
-
102
-
103
-
104
-
105
-
106
-
107
-
108
-
109
-
110
-
111
-
112
-
113
-
114
-
115
-
116
-
117
-
118
-
119
-
120
-
 121
121 -
 122
122 -
 123
123 -
 124
124 -
 125
125 -
 126
126 -
 127
127 -
 128
128 -
 129
129 -
 130
130 -
 131
131 -
 132
132 -
 133
133 -
 134
134 -
 135
135 -
 136
136 -
 137
137 -
 138
138 -
 139
139 -
 140
140 -
 141
141 -
142
-
143
-
144
-
145
-
146
-
147
-
148
-
149
-
150
-
151
-
152
-
153
-
154
-
155
-
156
-
157
-
158
-
159
-
160
-
161
-
162
-
163
-
164
-
165
-
166
-
167
-
168
-
169
-
170
-
171
-
172
-
173
-
174
-
175
-
176
-
177
-
178
-
179
-
180
-
181
-
182
-
183
-
184
-
185
-
186
-
187
-
188
 |
 |

Annual Report
We believe the counterparties to our foreign currency forward contracts are creditworthy multinational
commercial banks. While we believe the risk of counterparty nonperformance is not material, a sustained decline
in the financial stability of financial institutions as a result of disruption in the financial markets could affect our
ability to secure creditworthy counterparties for our foreign currency hedging programs.
Notwithstanding our efforts to mitigate some foreign currency exchange rate risks, there can be no assurance that
our hedging activities will adequately protect us against the risks associated with foreign currency fluctuations.
As of March 31, 2016, a hypothetical adverse foreign currency exchange rate movement of 10 percent or 20
percent would have resulted in potential declines in the fair value on our foreign currency forward contracts used
in cash flow hedging of $83 million and $167 million, respectively. As of March 31, 2016, a hypothetical adverse
foreign currency exchange rate movement of 10 percent or 20 percent would have resulted in potential losses on
our foreign currency forward contracts used in balance sheet hedging of $27 million and $53 million,
respectively. This sensitivity analysis assumes an adverse shift of all foreign currency exchange rates; however,
all foreign currency exchange rates do not always move in such manner and actual results may differ materially.
See Note 4 — Derivative Financial Instruments to the Consolidated Financial Statements in this Form 10-K as it
relates to our derivative financial instruments, which is incorporated by reference into this Item 7A.
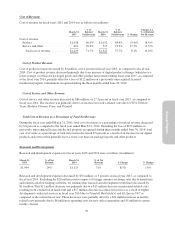
Interest Rate Risk
Our exposure to market risk for changes in interest rates relates primarily to our short-term investment portfolio.
We manage our interest rate risk by maintaining an investment portfolio generally consisting of debt instruments
of high credit quality and relatively short maturities. However, because short-term investments mature relatively
quickly and are required to be reinvested at the then-current market rates, interest income on a portfolio
consisting of short-term investments is more subject to market fluctuations than a portfolio of longer term
investments. Additionally, the contractual terms of the investments do not permit the issuer to call, prepay or
otherwise settle the investments at prices less than the stated par value. Our investments are held for purposes
other than trading. Also, we do not use derivative financial instruments in our short-term investment portfolio.
As of March 31, 2016, our short-term investments were classified as available-for-sale securities and,
consequently, were recorded at fair value with unrealized gains or losses resulting from changes in fair value
reported as a separate component of accumulated other comprehensive income, net of tax, in stockholders’
equity.
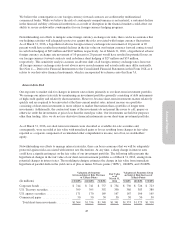
Notwithstanding our efforts to manage interest rate risks, there can be no assurance that we will be adequately
protected against risks associated with interest rate fluctuations. At any time, a sharp change in interest rates
could have a significant impact on the fair value of our investment portfolio. The following table presents the
hypothetical changes in the fair value of our short-term investment portfolio as of March 31, 2016, arising from
potential changes in interest rates. The modeling technique estimates the change in fair value from immediate
hypothetical parallel shifts in the yield curve of plus or minus 50 basis points (“BPS”), 100 BPS, and 150 BPS.
Valuation of Securities
Given an Interest Rate Decrease
of X Basis Points
Fair Value
as of
March 31,
2016
Valuation of Securities Given
an Interest Rate Increase of
X Basis Points
(In millions) (150 BPS) (100 BPS) (50 BPS) 50 BPS 100 BPS 150 BPS
Corporate bonds .................... $ 744 $ 741 $ 737 $ 734 $ 730 $ 726 $ 723
U.S. Treasury securities .............. 399 395 392 390 386 383 380
U.S. agency securities ............... 171 170 169 167 167 166 165
Commercial paper .................. 50 50 50 50 50 50 50
Total short-term investments ........ $1,364 $1,356 $1,348 $1,341 $1,333 $1,325 $1,318
45