Electronic Arts 2016 Annual Report Download - page 111
Download and view the complete annual report
Please find page 111 of the 2016 Electronic Arts annual report below. You can navigate through the pages in the report by either clicking on the pages listed below, or by using the keyword search tool below to find specific information within the annual report.-
 1
1 -
2
-
3
-
4
-
5
-
6
-
7
-
8
-
9
-
10
-
11
-
12
-
13
-
14
-
15
-
16
-
17
-
18
-
19
-
20
-
21
-
22
-
23
-
24
-
25
-
26
-
27
-
28
-
29
-
30
-
31
-
32
-
33
-
34
-
35
-
36
-
37
-
38
-
39
-
40
-
41
-
42
-
43
-
44
-
45
-
46
-
47
-
48
-
49
-
50
-
51
-
52
-
53
-
54
-
55
-
56
-
57
-
58
-
59
-
60
-
61
-
62
-
63
-
64
-
65
-
66
-
67
-
68
-
69
-
70
-
71
-
72
-
73
-
74
-
75
-
76
-
77
-
78
-
79
-
80
-
81
-
82
-
83
-
84
-
85
-
86
-
87
-
88
-
89
-
90
-
91
-
92
-
93
-
94
-
95
-
96
-
97
-
98
-
99
-
100
-
 101
101 -
 102
102 -
 103
103 -
 104
104 -
 105
105 -
 106
106 -
 107
107 -
 108
108 -
 109
109 -
 110
110 -
 111
111 -
 112
112 -
 113
113 -
 114
114 -
 115
115 -
 116
116 -
 117
117 -
 118
118 -
 119
119 -
 120
120 -
 121
121 -
122
-
123
-
124
-
125
-
126
-
127
-
128
-
129
-
130
-
131
-
132
-
133
-
134
-
135
-
136
-
137
-
138
-
139
-
140
-
141
-
142
-
143
-
144
-
145
-
146
-
147
-
148
-
149
-
150
-
151
-
152
-
153
-
154
-
155
-
156
-
157
-
158
-
159
-
160
-
161
-
162
-
163
-
164
-
165
-
166
-
167
-
168
-
169
-
170
-
171
-
172
-
173
-
174
-
175
-
176
-
177
-
178
-
179
-
180
-
181
-
182
-
183
-
184
-
185
-
186
-
187
-
188
 |
 |

Annual Report
Item 7: Management’s Discussion and Analysis of Financial Condition and Results of Operations
OVERVIEW
The following overview is a high-level discussion of our operating results, as well as some of the trends and
drivers that affect our business. Management believes that an understanding of these trends and drivers provides
important context for our results for the fiscal year ended March 31, 2016, as well as our future prospects. This
summary is not intended to be exhaustive, nor is it intended to be a substitute for the detailed discussion and
analysis provided elsewhere in this Form 10-K, including in the “Business” section and the “Risk Factors” above,
the remainder of this “Management’s Discussion and Analysis of Financial Condition and Results of Operations
(“MD&A”)”, and the Consolidated Financial Statements and related Notes.
About Electronic Arts
We are a global leader in digital interactive entertainment. We develop, market, publish and distribute games,
content and services that can be played by consumers on a variety of platforms, which include consoles (such as
the PlayStation from Sony, and the Xbox from Microsoft), PCs, mobile phones and tablets. Some of our games
are based on our wholly-owned intellectual property (e.g., Battlefield, Mass Effect, Need for Speed, The Sims
and Plants vs. Zombies), and some of our games leverage content that we license from others (e.g., FIFA,
Madden NFL and Star Wars). We also publish and distribute games developed by third parties (e.g., Titanfall).
Our products and services may be purchased through multiple distribution channels, including physical and
online retailers, platform providers such as console manufacturers, providers of free-to-download PC games,
mobile carriers and directly through Origin, our own digital distribution platform.
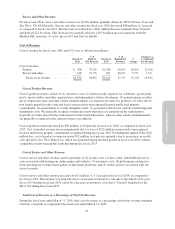
Financial Results
Our key financial results for our fiscal year ended March 31, 2016 were as follows:
• Total net revenue was $4,396 million, down 3 percent year-over-year. Excluding the negative impact of
foreign currency exchange rates, we estimate that total net revenue would have been $4,662 million, up
3 percent year over year.
• Digital revenue was $2,409 million, up 10 percent year-over-year.
• International net revenue was $2,489 million, down 3 percent year-over-year.
• Gross margin was 69.2 percent.
• Operating expenses were $2,144 million.
• Net income was $1,156 million, with diluted earnings per share of $3.50.
• Operating cash flow was $1,223 million.
• Cash and cash equivalents were $2,493 million and short-term investments were $1,341 million.
Trends in Our Business
Digital Transformation. Our business continues to transform from a traditional packaged goods business model
to one in which our games and services are sold and delivered digitally, with additional content, features and
services helping to extend the life of our packaged goods and digital games. For example, the Ultimate Team
mode incorporated into iterations of our FIFA, Madden NFL and NHL franchises and expansion packs available
digitally for our Star Wars, Battlefield and Sims franchises have kept many of our players engaged with those
games for longer periods of time. Our digital transformation is also creating opportunities in platforms, content
models and modalities of play. For example, we have leveraged franchises typically associated with consoles and
traditional PC gaming, such as FIFA, Madden NFL, The Sims, SimCity and Star Wars, to create mobile and PC
free-to-download games that are monetized through a business model through which we sell incremental content
and/or features in discrete transactions. We also provide our EA Access service for the Xbox One and Origin
Access service on PC, which offer players access to a selection of EA games and other benefits for a monthly or
annual fee.
25