Electronic Arts 2016 Annual Report Download - page 136
Download and view the complete annual report
Please find page 136 of the 2016 Electronic Arts annual report below. You can navigate through the pages in the report by either clicking on the pages listed below, or by using the keyword search tool below to find specific information within the annual report.-
 1
1 -
2
-
3
-
4
-
5
-
6
-
7
-
8
-
9
-
10
-
11
-
12
-
13
-
14
-
15
-
16
-
17
-
18
-
19
-
20
-
21
-
22
-
23
-
24
-
25
-
26
-
27
-
28
-
29
-
30
-
31
-
32
-
33
-
34
-
35
-
36
-
37
-
38
-
39
-
40
-
41
-
42
-
43
-
44
-
45
-
46
-
47
-
48
-
49
-
50
-
51
-
52
-
53
-
54
-
55
-
56
-
57
-
58
-
59
-
60
-
61
-
62
-
63
-
64
-
65
-
66
-
67
-
68
-
69
-
70
-
71
-
72
-
73
-
74
-
75
-
76
-
77
-
78
-
79
-
80
-
81
-
82
-
83
-
84
-
85
-
86
-
87
-
88
-
89
-
90
-
91
-
92
-
93
-
94
-
95
-
96
-
97
-
98
-
99
-
100
-
101
-
102
-
103
-
104
-
105
-
106
-
107
-
108
-
109
-
110
-
111
-
112
-
113
-
114
-
115
-
116
-
117
-
118
-
119
-
120
-
121
-
122
-
123
-
124
-
125
-
 126
126 -
 127
127 -
 128
128 -
 129
129 -
 130
130 -
 131
131 -
 132
132 -
 133
133 -
 134
134 -
 135
135 -
 136
136 -
 137
137 -
 138
138 -
 139
139 -
 140
140 -
 141
141 -
 142
142 -
 143
143 -
 144
144 -
 145
145 -
 146
146 -
147
-
148
-
149
-
150
-
151
-
152
-
153
-
154
-
155
-
156
-
157
-
158
-
159
-
160
-
161
-
162
-
163
-
164
-
165
-
166
-
167
-
168
-
169
-
170
-
171
-
172
-
173
-
174
-
175
-
176
-
177
-
178
-
179
-
180
-
181
-
182
-
183
-
184
-
185
-
186
-
187
-
188
 |
 |

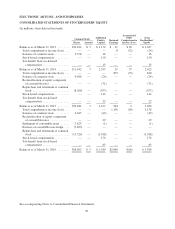
ELECTRONIC ARTS INC. AND SUBSIDIARIES
CONSOLIDATED STATEMENTS OF STOCKHOLDERS’ EQUITY
(In millions, share data in thousands)
Common Stock Additional
Paid-in
Capital
Retained
Earnings
Accumulated
Other
Comprehensive
Income (Loss)
Total
Stockholders’
EquityShares Amount
Balances as of March 31, 2013 ........ 302,164 $ 3 $ 2,174 $ 21 $ 69 $ 2,267
Total comprehensive income (loss) . . . — — — 8 (32) (24)
Issuance of common stock .......... 9,278 — 16 — — 16
Stock-based compensation .......... — — 150 — — 150
Tax benefit from stock-based
compensation .................. — — 13 — — 13
Balances as of March 31, 2014 ........ 311,442 3 2,353 29 37 2,422
Total comprehensive income (loss) . . . — — — 875 (35) 840
Issuance of common stock .......... 6,508 — (24) — — (24)
Reclassification of equity component
of convertible notes ............. — — (31) — — (31)
Repurchase and retirement of common
stock ......................... (8,269) — (337) — — (337)
Stock-based compensation .......... — — 144 — — 144
Tax benefit from stock-based
compensation .................. — — 22 — — 22
Balances as of March 31, 2015 ........ 309,681 3 2,127 904 2 3,036
Total comprehensive income (loss) . . . — — — 1,156 (18) 1,138
Issuance of common stock .......... 6,645 — (49) — — (49)
Reclassification of equity component
of convertible notes ............. — — 29 — — 29
Settlement of convertible notes ...... 7,823 — (1) — — (1)
Exercise of convertible note hedge . . . (7,823) — — — — —
Repurchase and retirement of common
stock ......................... (15,724) — (1,018) — — (1,018)
Stock-based compensation .......... — — 178 — — 178
Tax benefit from stock-based
compensation .................. — — 83 — — 83
Balances as of March 31, 2016 ........ 300,602 $ 3 $ 1,349 $2,060 $(16) $ 3,396
See accompanying Notes to Consolidated Financial Statements.
50