Electronic Arts 2016 Annual Report Download - page 37
Download and view the complete annual report
Please find page 37 of the 2016 Electronic Arts annual report below. You can navigate through the pages in the report by either clicking on the pages listed below, or by using the keyword search tool below to find specific information within the annual report.-
 1
1 -
2
-
3
-
4
-
5
-
6
-
7
-
8
-
9
-
10
-
11
-
12
-
13
-
14
-
15
-
16
-
17
-
18
-
19
-
20
-
21
-
22
-
23
-
24
-
25
-
26
-
 27
27 -
 28
28 -
 29
29 -
 30
30 -
 31
31 -
 32
32 -
 33
33 -
 34
34 -
 35
35 -
 36
36 -
 37
37 -
 38
38 -
 39
39 -
 40
40 -
 41
41 -
 42
42 -
 43
43 -
 44
44 -
 45
45 -
 46
46 -
 47
47 -
48
-
49
-
50
-
51
-
52
-
53
-
54
-
55
-
56
-
57
-
58
-
59
-
60
-
61
-
62
-
63
-
64
-
65
-
66
-
67
-
68
-
69
-
70
-
71
-
72
-
73
-
74
-
75
-
76
-
77
-
78
-
79
-
80
-
81
-
82
-
83
-
84
-
85
-
86
-
87
-
88
-
89
-
90
-
91
-
92
-
93
-
94
-
95
-
96
-
97
-
98
-
99
-
100
-
101
-
102
-
103
-
104
-
105
-
106
-
107
-
108
-
109
-
110
-
111
-
112
-
113
-
114
-
115
-
116
-
117
-
118
-
119
-
120
-
121
-
122
-
123
-
124
-
125
-
126
-
127
-
128
-
129
-
130
-
131
-
132
-
133
-
134
-
135
-
136
-
137
-
138
-
139
-
140
-
141
-
142
-
143
-
144
-
145
-
146
-
147
-
148
-
149
-
150
-
151
-
152
-
153
-
154
-
155
-
156
-
157
-
158
-
159
-
160
-
161
-
162
-
163
-
164
-
165
-
166
-
167
-
168
-
169
-
170
-
171
-
172
-
173
-
174
-
175
-
176
-
177
-
178
-
179
-
180
-
181
-
182
-
183
-
184
-
185
-
186
-
187
-
188
 |
 |

Proxy Statement
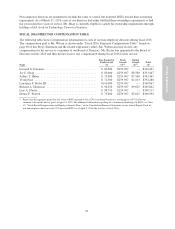
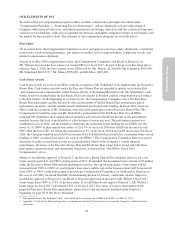
The annual cash bonuses paid to all our NEOs are determined pursuant to the following guidelines:
Base
Salary X
Bonus Target
Percentage (%
of Base Salary)
XCompany Bonus
Funding Percentage X
Adjustment
Based on
Business
Unit (if
applicable)
and Individual
Performance
=NEO Bonus
Payout
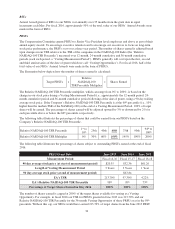
Company Bonus Funding Percentage: In order to align our NEOs’ bonus payouts to the performance of the
Company, each NEO’s bonus is tied to the bonus funding percentage applied to our overall Company bonus pool.
In fiscal 2016, our non-GAAP net revenue of $4.57 billion was approximately 104% of our $4.40 billion target
and reflected a 5.8% increase from our fiscal 2015 non-GAAP net revenue of 4.32 billion. Our non-GAAP
diluted earnings per share of $3.14 for fiscal 2016 was approximately 114% of our $2.75 target and reflected a
25% increase from our fiscal 2015 non-GAAP earning per share of $2.51. As a result, in fiscal 2016, the
Compensation Committee funded our overall Company bonus pool at 108.3% of aggregate employee target
bonuses. In making this determination, the Compensation Committee considered the equal weighting of our non-
GAAP net revenue and non-GAAP diluted earnings per share, which together accounted for 100% of the
Company bonus funding percentage. Our bonus plans permit the Compensation Committee to exercise discretion
to adjust the bonus funding percentage based on business performance criteria; however, the bonus funding
percentage has been solely based on the Company’s financial performance for the past two fiscal years.
Appendix A to this Proxy Statement provides a calculation of non-GAAP financial measures from the
Company’s audited financial statements.
Business Unit and Individual Performance: The Board of Directors (in the case of Mr. Wilson) and the
Compensation Committee, in consultation with Mr. Wilson and our Chief Talent Officer (in the case of all other
NEOs) assessed business unit (if applicable) and individual performance as set forth below in determining the
final bonus payouts.
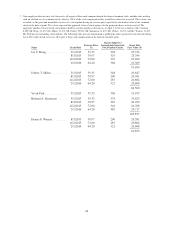
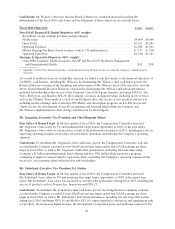
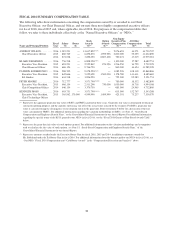
FISCAL 2016 BASE SALARY AND CASH BONUS FOR NEOs
Base Salary
Earned in Fiscal
2016
Target Annual
Bonus
Award
Company Bonus
Funding
Percentage
(108.3%)
Fiscal 2016
Cash Bonus
Mr. Wilson ............................... $983,333 $1,475,000 $1,597,425 $2,076,653
Mr. Jorgensen ............................. $729,167 $ 729,167 $ 789,688 $1,100,000
Mr. Söderlund(1) ........................... $588,702 $ 588,702 $ 637,564 $1,085,526
Mr. Moore ................................ $690,100 $ 686,750 $ 743,750 $ 780,000
Mr. Moss ................................. $582,084 $ 436,563 $ 472,798 $ 615,000
(1) Mr. Söderlund resides in Stockholm, Sweden and is paid in Swedish krona (“SEK”). The amounts set forth in this table (except for
Mr. Söderlund’s fiscal 2016 Cash Bonus) were derived from an average of the SEK to USD exchange rates on the last day of each month
during fiscal 2016. The amount set forth as Mr. Söderlund’s fiscal 2016 cash bonus, which was paid on June 3, 2016, is based on the
exchange rate as of May 25, 2016.
Cash bonuses represented approximately one-half of our NEOs’ target total cash compensation and the same
portion of our NEOs’ realized total cash compensation for fiscal 2016, thus putting at risk a significant portion of
our NEO’s cash compensation.
Mr. Wilson, Chief Executive Officer
Base Salary & Bonus Target:In the first quarter of fiscal 2016, the Board of Directors increased Mr. Wilson’s
base salary by 11% and maintained his target bonus opportunity at 150% of his base salary. Mr. Wilson’s base
salary was increased as a result of his performance and the financial and operating performance of the Company
during fiscal 2015 and to better align his base salary with the base salaries for CEOs in our peer group. While
Mr. Wilson’s resulting base salary and target total cash compensation were below the median for CEOs in our
peer group, the Board of Directors determined that Mr. Wilson’s aggregate compensation package (base, target
bonus and equity award) was appropriate relative to his tenure in the role.
29