Electronic Arts 2016 Annual Report Download - page 112
Download and view the complete annual report
Please find page 112 of the 2016 Electronic Arts annual report below. You can navigate through the pages in the report by either clicking on the pages listed below, or by using the keyword search tool below to find specific information within the annual report.-
 1
1 -
2
-
3
-
4
-
5
-
6
-
7
-
8
-
9
-
10
-
11
-
12
-
13
-
14
-
15
-
16
-
17
-
18
-
19
-
20
-
21
-
22
-
23
-
24
-
25
-
26
-
27
-
28
-
29
-
30
-
31
-
32
-
33
-
34
-
35
-
36
-
37
-
38
-
39
-
40
-
41
-
42
-
43
-
44
-
45
-
46
-
47
-
48
-
49
-
50
-
51
-
52
-
53
-
54
-
55
-
56
-
57
-
58
-
59
-
60
-
61
-
62
-
63
-
64
-
65
-
66
-
67
-
68
-
69
-
70
-
71
-
72
-
73
-
74
-
75
-
76
-
77
-
78
-
79
-
80
-
81
-
82
-
83
-
84
-
85
-
86
-
87
-
88
-
89
-
90
-
91
-
92
-
93
-
94
-
95
-
96
-
97
-
98
-
99
-
100
-
101
-
 102
102 -
 103
103 -
 104
104 -
 105
105 -
 106
106 -
 107
107 -
 108
108 -
 109
109 -
 110
110 -
 111
111 -
 112
112 -
 113
113 -
 114
114 -
 115
115 -
 116
116 -
 117
117 -
 118
118 -
 119
119 -
 120
120 -
 121
121 -
 122
122 -
123
-
124
-
125
-
126
-
127
-
128
-
129
-
130
-
131
-
132
-
133
-
134
-
135
-
136
-
137
-
138
-
139
-
140
-
141
-
142
-
143
-
144
-
145
-
146
-
147
-
148
-
149
-
150
-
151
-
152
-
153
-
154
-
155
-
156
-
157
-
158
-
159
-
160
-
161
-
162
-
163
-
164
-
165
-
166
-
167
-
168
-
169
-
170
-
171
-
172
-
173
-
174
-
175
-
176
-
177
-
178
-
179
-
180
-
181
-
182
-
183
-
184
-
185
-
186
-
187
-
188
 |
 |
Our digital transformation also gives us the opportunity to strengthen our player network. We are investing in a
technology foundation to enable us to build player relationships that can last for years instead of for days or
weeks by connecting our players to us and to each other. This connection allows us to market and deliver content
and services for popular franchises like FIFA, Battlefield and Star Wars to our players more efficiently. That
same foundation also enables new player-centric ways to discover and try new experiences, such as our
subscription-based EA Access and Origin Access services.
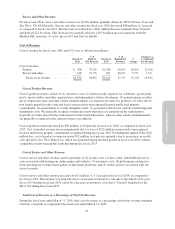
We significantly increased our digital net revenue from $1,833 million in fiscal year 2014 to $2,199 million in
fiscal year 2015 and $2,409 million during fiscal year 2016. We expect this portion of our business to continue to
grow through fiscal year 2017 and beyond as we continue to focus on developing and monetizing products and
services that can be delivered digitally.
Foreign Currency Exchange Rates. International sales are a fundamental part of our business, and the
strengthening of the U.S. dollar (particularly relative to the Euro, British pound sterling, Australian dollar,
Chinese yuan and South Korean won) has a negative impact on our reported international net revenue, but a
positive impact on our reported international operating expenses (particularly the Swedish krona and Canadian
dollar) because these amounts are translated at lower rates as compared to periods in which the U.S. Dollar is
weaker. While we use foreign currency hedging contracts to mitigate some foreign currency exchange risk, these
activities are limited in the protection that they provide us and can themselves result in losses. We estimate that
foreign currency exchange rates had a negative impact of $266 million on our reported net revenue during fiscal
year 2016 as compared to fiscal year 2015, but the strengthening of the U.S. dollar had a positive impact of $113
million on our reported operating expenses as a significant portion of those expenses are incurred outside the
United States.
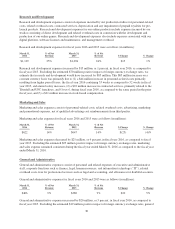
Mobile and PC Free-to-Download Games. The proliferation of mobile phones and tablets has significantly
increased the consumer base for mobile games. The broad consumer acceptance of business models which allow
consumers to try new games with no up-front cost and pay for additional content or in-game items, has led to
growth in the mobile gaming industry. Likewise, the mass introduction and wide consumer acceptance of free-to-
download, micro-transaction-based PC games played over the Internet has also broadened our consumer base.
We expect revenue generated from mobile and PC free-to-download games to remain an important part of our
business.
We track an estimate of monthly active users (“MAUs”) for our mobile business, which we believe is a useful
indicator of player engagement trends for that business. For the fiscal year ended March 31, 2016, we had
average MAUs of over 160 million. MAUs are the aggregate number of individuals who accessed a particular
game on a particular device in the last 30 days as of the measurement date. For our calculation, an individual who
either plays two of our games on a single device, or the same game on two devices in the relevant period, would
be counted as two users. Average MAUs for a particular period is the average of the MAUs at each month-end
during that period. MAUs are calculated using internal company data based on tracking the activity of user
accounts. We also include in this calculation data provided by our third party publishing partners for certain
games that we develop but we exclude information from third party titles that we publish. From time to time, we
adjust the calculation for user activity that is inconsistent with our methodology. We believe that the numbers are
reasonable estimates of our user base for the applicable period of measurement; however, factors relating to user
activity may impact these numbers. Our methodology for calculating MAUs may differ from the methodology
used by other companies to calculate this metric.
Concentration of Sales Among the Most Popular Games. In all major segments of our industry, we see a large
portion of games sales concentrated on the most popular titles, and many of those titles are sequels of prior
games. Similarly, a significant portion of our revenue historically has been derived from games and services
based on a few popular franchises, several of which we have released on an annual or bi-annual basis. For
example, in fiscal year 2016, net revenue generated from the sale of products and services associated with our
three largest franchises accounted for approximately 55 percent of our net revenue. We expect this trend to
continue.
26