DIRECTV 2009 Annual Report Download - page 70
Download and view the complete annual report
Please find page 70 of the 2009 DIRECTV annual report below. You can navigate through the pages in the report by either clicking on the pages listed below, or by using the keyword search tool below to find specific information within the annual report.-
 1
1 -
2
-
3
-
4
-
5
-
6
-
7
-
8
-
9
-
10
-
11
-
12
-
13
-
14
-
15
-
16
-
17
-
18
-
19
-
20
-
21
-
22
-
23
-
24
-
25
-
26
-
27
-
28
-
29
-
30
-
31
-
32
-
33
-
34
-
35
-
36
-
37
-
38
-
39
-
40
-
41
-
42
-
43
-
44
-
45
-
46
-
47
-
48
-
49
-
50
-
51
-
52
-
53
-
54
-
55
-
56
-
57
-
58
-
59
-
 60
60 -
 61
61 -
 62
62 -
 63
63 -
 64
64 -
 65
65 -
 66
66 -
 67
67 -
 68
68 -
 69
69 -
 70
70 -
 71
71 -
 72
72 -
 73
73 -
 74
74 -
 75
75 -
 76
76 -
 77
77 -
 78
78 -
 79
79 -
 80
80 -
81
-
82
-
83
-
84
-
85
-
86
-
87
-
88
-
89
-
90
-
91
-
92
-
93
-
94
-
95
-
96
-
97
-
98
-
99
-
100
-
101
-
102
-
103
-
104
-
105
-
106
-
107
-
108
-
109
-
110
-
111
-
112
-
113
-
114
-
115
-
116
-
117
-
118
-
119
-
120
-
121
-
122
-
123
-
124
-
125
-
126
-
127
-
128
-
129
-
130
-
131
-
132
-
133
-
134
-
135
-
136
-
137
-
138
-
139
-
140
-
141
-
142
-
143
-
144
-
145
-
146
-
147
-
148
-
149
-
150
-
151
-
152
-
153
-
154
-
155
-
156
-
157
-
158
-
159
-
160
 |
 |

DIRECTV
The lower operating profit was primarily due to the increase in operating profit before
depreciation and amortization, offset by higher depreciation and amortization expense primarily due to
an increase in basic and advance product receivers leased over the last year.
Sports Networks, Eliminations and Other
Operating loss from Sports Networks, Elimination and Other increased to $68 million in 2009 from
$61 million in 2008. Sports Networks, Eliminations and Other primarily consisted of corporate
operating costs until November 19, 2009 when we completed the Liberty Transaction and acquired the
RSNs.
Year Ended December 31, 2008 Compared with the Year Ended December 31, 2007
Consolidated Results of Operations
We discuss changes for each of our segments in more detail below.
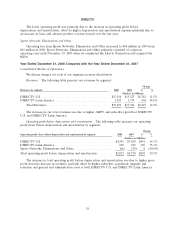
Revenues. The following table presents our revenues by segment:
Change
Revenues by segment: 2008 2007 $ %
(Dollars in Millions)
DIRECTV U.S. ..................................... $17,310 $15,527 $1,783 11.5%
DIRECTV Latin America .............................. 2,383 1,719 664 38.6%
Total Revenues ................................... $19,693 $17,246 $2,447 14.2%
The increase in our total revenues was due to higher ARPU and subscriber growth at DIRECTV
U.S. and DIRECTV Latin America.
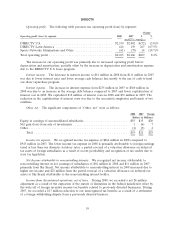
Operating profit before depreciation and amortization. The following table presents our operating
profit (loss) before depreciation and amortization by segment:
Change
Operating profit (loss) before depreciation and amortization by segment: 2008 2007 $ %
(Dollars in Millions)
DIRECTV U.S. ........................................ $4,391 $3,850 $541 14.1%
DIRECTV Latin America ................................. 690 394 296 75.1%
Sports Networks, Eliminations and Other ...................... (66) (74) 8 (10.8)%
Total operating profit before depreciation and amortization ......... $5,015 $4,170 $845 20.3%
The increase in total operating profit before depreciation and amortization was due to higher gross
profit from the increase in revenues, partially offset by higher subscriber acquisition, upgrade and
retention and general and administrative costs at both DIRECTV U.S. and DIRECTV Latin America.
58