DIRECTV 2009 Annual Report Download - page 68
Download and view the complete annual report
Please find page 68 of the 2009 DIRECTV annual report below. You can navigate through the pages in the report by either clicking on the pages listed below, or by using the keyword search tool below to find specific information within the annual report.-
 1
1 -
2
-
3
-
4
-
5
-
6
-
7
-
8
-
9
-
10
-
11
-
12
-
13
-
14
-
15
-
16
-
17
-
18
-
19
-
20
-
21
-
22
-
23
-
24
-
25
-
26
-
27
-
28
-
29
-
30
-
31
-
32
-
33
-
34
-
35
-
36
-
37
-
38
-
39
-
40
-
41
-
42
-
43
-
44
-
45
-
46
-
47
-
48
-
49
-
50
-
51
-
52
-
53
-
54
-
55
-
56
-
57
-
 58
58 -
 59
59 -
 60
60 -
 61
61 -
 62
62 -
 63
63 -
 64
64 -
 65
65 -
 66
66 -
 67
67 -
 68
68 -
 69
69 -
 70
70 -
 71
71 -
 72
72 -
 73
73 -
 74
74 -
 75
75 -
 76
76 -
 77
77 -
 78
78 -
79
-
80
-
81
-
82
-
83
-
84
-
85
-
86
-
87
-
88
-
89
-
90
-
91
-
92
-
93
-
94
-
95
-
96
-
97
-
98
-
99
-
100
-
101
-
102
-
103
-
104
-
105
-
106
-
107
-
108
-
109
-
110
-
111
-
112
-
113
-
114
-
115
-
116
-
117
-
118
-
119
-
120
-
121
-
122
-
123
-
124
-
125
-
126
-
127
-
128
-
129
-
130
-
131
-
132
-
133
-
134
-
135
-
136
-
137
-
138
-
139
-
140
-
141
-
142
-
143
-
144
-
145
-
146
-
147
-
148
-
149
-
150
-
151
-
152
-
153
-
154
-
155
-
156
-
157
-
158
-
159
-
160
 |
 |
DIRECTV
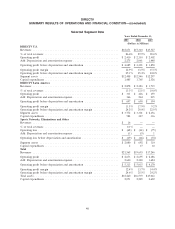
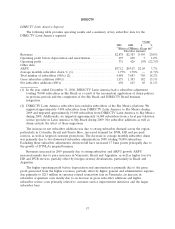
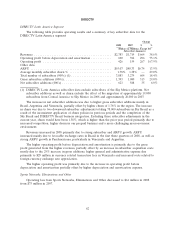
Revenues. DIRECTV U.S.’ revenues increased as a result of the larger subscriber base and higher
ARPU. The increase in ARPU resulted primarily from price increases on programming packages,
higher HD and DVR product penetration, partially offset by more competitive customer promotions,
the elimination of satellite lease revenue and lower premium movie package buy rates.
Operating profit before depreciation and amortization. The improvement of operating profit before
depreciation and amortization was primarily due to the gross profit generated from the higher
revenues, partially offset by higher subscriber acquisition costs principally related to the increase in
gross subscriber additions.
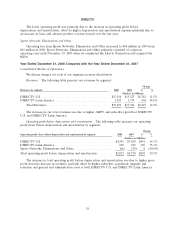
Broadcast programming and other costs increased due to the larger number of subscribers in 2009
and annual program supplier rate increases. Subscriber service expenses increased primarily due to a
larger subscriber base in 2009 and costs associated with service quality improvement initiatives.
Subscriber acquisition costs increased primarily due to an increase in gross subscriber additions
compared to 2008 and increased marketing and advertising costs. SAC per subscriber, which includes
the cost of capitalized set-top receivers, decreased primarily due to lower set-top receiver costs and
greater savings related to the increased usage of refurbished set-top receivers through our lease
program.
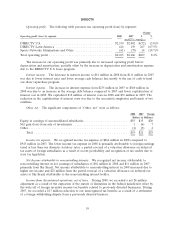
Upgrade and retention costs increased in 2009 primarily due to the larger subscriber base, partially
offset by decreased installation costs and decreased spending on other programs due to stricter
spending policies.
General and administrative expenses increased in 2009 primarily due to increased labor and benefit
expense from the increase in headcount within our owned and operated home service provider
installation business, partially offset by a $14 million charge in 2008 for the write-off of accounts
receivable for equipment and other costs incurred to effect the orderly transition of services from one
of our home service providers that ceased operations.
Operating profit. The increase in operating profit was primarily due to higher operating profit
before depreciation and amortization, partially offset by higher depreciation and amortization expense
in 2009 resulting from the capitalization of set-top receivers under the lease program.
56