DIRECTV 2009 Annual Report Download - page 63
Download and view the complete annual report
Please find page 63 of the 2009 DIRECTV annual report below. You can navigate through the pages in the report by either clicking on the pages listed below, or by using the keyword search tool below to find specific information within the annual report.-
 1
1 -
2
-
3
-
4
-
5
-
6
-
7
-
8
-
9
-
10
-
11
-
12
-
13
-
14
-
15
-
16
-
17
-
18
-
19
-
20
-
21
-
22
-
23
-
24
-
25
-
26
-
27
-
28
-
29
-
30
-
31
-
32
-
33
-
34
-
35
-
36
-
37
-
38
-
39
-
40
-
41
-
42
-
43
-
44
-
45
-
46
-
47
-
48
-
49
-
50
-
51
-
52
-
 53
53 -
 54
54 -
 55
55 -
 56
56 -
 57
57 -
 58
58 -
 59
59 -
 60
60 -
 61
61 -
 62
62 -
 63
63 -
 64
64 -
 65
65 -
 66
66 -
 67
67 -
 68
68 -
 69
69 -
 70
70 -
 71
71 -
 72
72 -
 73
73 -
74
-
75
-
76
-
77
-
78
-
79
-
80
-
81
-
82
-
83
-
84
-
85
-
86
-
87
-
88
-
89
-
90
-
91
-
92
-
93
-
94
-
95
-
96
-
97
-
98
-
99
-
100
-
101
-
102
-
103
-
104
-
105
-
106
-
107
-
108
-
109
-
110
-
111
-
112
-
113
-
114
-
115
-
116
-
117
-
118
-
119
-
120
-
121
-
122
-
123
-
124
-
125
-
126
-
127
-
128
-
129
-
130
-
131
-
132
-
133
-
134
-
135
-
136
-
137
-
138
-
139
-
140
-
141
-
142
-
143
-
144
-
145
-
146
-
147
-
148
-
149
-
150
-
151
-
152
-
153
-
154
-
155
-
156
-
157
-
158
-
159
-
160
 |
 |
DIRECTV
capitalized each period for upgrade and retention programs is included in ‘‘Cash paid for property and
equipment’’ in the Consolidated Statements of Cash Flows.
General and Administrative Expenses. General and administrative expenses include departmental
costs for legal, administrative services, finance, marketing and information technology. These costs also
include expenses for bad debt and other operating expenses, such as legal settlements, and gains or
losses from the sale or disposal of fixed assets.
Average Monthly Revenue Per Subscriber. We calculate ARPU by dividing average monthly
revenues for the period (total revenues during the period divided by the number of months in the
period) by average subscribers for the period. We calculate average subscribers for the period by adding
the number of subscribers as of the beginning of the period and for each quarter end in the current
year or period and dividing by the sum of the number of quarters in the period plus one.
Average Monthly Subscriber Churn. Average monthly subscriber churn represents the number of
subscribers whose service is disconnected, expressed as a percentage of the average total number of
subscribers. We calculate average monthly subscriber churn by dividing the average monthly number of
disconnected subscribers for the period (total subscribers disconnected, net of reconnects, during the
period divided by the number of months in the period) by average subscribers for the period.
Subscriber Count. The total number of subscribers represents the total number of subscribers
actively subscribing to our service, including seasonal subscribers, subscribers who are in the process of
relocating and commercial equivalent viewing units. In March 2008, we implemented a change in
DIRECTV U.S.’ commercial pricing and packaging to increase our competitiveness. As a result, during
the first quarter of 2008, DIRECTV U.S. made a one-time downward adjustment to the subscriber
count of approximately 71,000 subscribers related to commercial equivalent viewing units.
SAC. We calculate SAC, which represents total subscriber acquisition costs stated on a per
subscriber basis, by dividing total subscriber acquisition costs for the period by the number of gross new
subscribers acquired during the period. We calculate total subscriber acquisition costs for the period by
adding together ‘‘Subscriber acquisition costs’’ expensed during the period and the amount of cash paid
for equipment leased to new subscribers during the period.
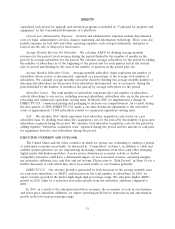
EXECUTIVE OVERVIEW AND OUTLOOK
The United States and the other countries in which we operate are continuing to undergo a period
of substantial economic uncertainty. As discussed in ‘‘Competition’’ in Item 1, in addition to cable and
satellite system operators, we are experiencing increasing competition from telcos and other emerging
digital media distribution providers. A more severe downturn in economic activity or further
competitive pressures could have a detrimental impact on our forecasted revenue, operating margins,
net subscriber additions, free cash flow and net income. Please refer to ‘‘Risk Factors’’ in Item 1A for a
further discussion of risks which may affect forecasted results or our business generally.
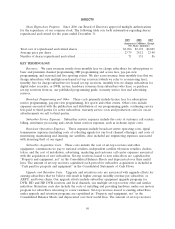
DIRECTV U.S. Our revenue growth is generated by both increases in the average monthly rates
we earn from subscribers, or ARPU, and increases in the total number of subscribers. In 2010, we
expect revenue growth in the mid-to-high single digit percentage range. We anticipate higher ARPU
growth in 2010, offset by a reduction in revenue growth from net subscriber additions compared to
2009.
In 2010, as a result of the anticipated growth in revenues, the economies of scale in our business,
and lower gross subscriber additions, we expect operating profit before depreciation and amortization
growth in the low-teens percentage range.
51