DIRECTV 2009 Annual Report Download - page 67
Download and view the complete annual report
Please find page 67 of the 2009 DIRECTV annual report below. You can navigate through the pages in the report by either clicking on the pages listed below, or by using the keyword search tool below to find specific information within the annual report.-
 1
1 -
2
-
3
-
4
-
5
-
6
-
7
-
8
-
9
-
10
-
11
-
12
-
13
-
14
-
15
-
16
-
17
-
18
-
19
-
20
-
21
-
22
-
23
-
24
-
25
-
26
-
27
-
28
-
29
-
30
-
31
-
32
-
33
-
34
-
35
-
36
-
37
-
38
-
39
-
40
-
41
-
42
-
43
-
44
-
45
-
46
-
47
-
48
-
49
-
50
-
51
-
52
-
53
-
54
-
55
-
56
-
 57
57 -
 58
58 -
 59
59 -
 60
60 -
 61
61 -
 62
62 -
 63
63 -
 64
64 -
 65
65 -
 66
66 -
 67
67 -
 68
68 -
 69
69 -
 70
70 -
 71
71 -
 72
72 -
 73
73 -
 74
74 -
 75
75 -
 76
76 -
 77
77 -
78
-
79
-
80
-
81
-
82
-
83
-
84
-
85
-
86
-
87
-
88
-
89
-
90
-
91
-
92
-
93
-
94
-
95
-
96
-
97
-
98
-
99
-
100
-
101
-
102
-
103
-
104
-
105
-
106
-
107
-
108
-
109
-
110
-
111
-
112
-
113
-
114
-
115
-
116
-
117
-
118
-
119
-
120
-
121
-
122
-
123
-
124
-
125
-
126
-
127
-
128
-
129
-
130
-
131
-
132
-
133
-
134
-
135
-
136
-
137
-
138
-
139
-
140
-
141
-
142
-
143
-
144
-
145
-
146
-
147
-
148
-
149
-
150
-
151
-
152
-
153
-
154
-
155
-
156
-
157
-
158
-
159
-
160
 |
 |

DIRECTV
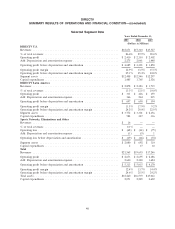
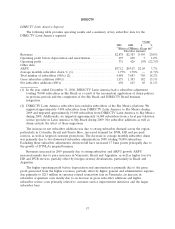
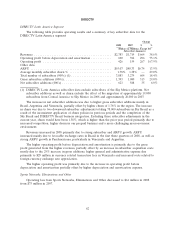
DIRECTV U.S. Segment
The following table provides operating results and a summary of key subscriber data for the
DIRECTV U.S. segment:
Change
2009 2008 $ %
(Dollars in Millions, Except Per
Subscriber Amounts)
Revenues ........................................... $18,671 $17,310 $1,361 7.9%
Operating costs and expenses
Costs of revenues, exclusive of depreciation and amortization
expense
Broadcast programming and other .................. 8,027 7,424 603 8.1%
Subscriber service expenses ....................... 1,268 1,139 129 11.3%
Broadcast operations expenses ..................... 274 265 9 3.4%
Selling, general and administrative expenses, exclusive of
depreciation and amortization expense
Subscriber acquisition costs ....................... 2,478 2,191 287 13.1%
Upgrade and retention costs ...................... 1,045 1,027 18 1.8%
General and administrative expenses ................ 894 873 21 2.4%
Depreciation and amortization expense ..................... 2,275 2,061 214 10.4%
Total operating costs and expenses .............. 16,261 14,980 1,281 8.6%
Operating profit ...................................... $ 2,410 $ 2,330 $ 80 3.4%
Other data:
Operating profit before depreciation and amortization .......... $ 4,685 $ 4,391 $ 294 6.7%
Total number of subscribers (000’s) (1) ..................... 18,560 17,621 939 5.3%
ARPU ............................................. $ 85.48 $ 83.90 $ 1.58 1.9%
Average monthly subscriber churn % ...................... 1.53% 1.47% — 4.1%
Gross subscriber additions (000’s) ......................... 4,273 3,904 369 9.5%
Subscriber disconnections (000’s) ......................... 3,334 3,043 291 9.6%
Net subscriber additions (000’s) .......................... 939 861 78 9.1%
Average subscriber acquisition costs—per subscriber (SAC) ...... $ 712 $ 715 $ (3) (0.4)%
(1) As discussed above in ‘‘Key Terminology,’’ during 2008, we had a one-time downward adjustment
to our subscriber count of approximately 71,000 subscribers related to commercial equivalent
viewing units. This adjustment did not affect our revenue, operating profit, cash flows, net
subscriber additions or average monthly subscriber churn.
Subscribers. In 2009, gross subscriber additions increased primarily due to more aggressive
promotions, marketing of the AT&T/DIRECTV bundle which began in February 2009, higher demand
for advanced services and the impact of the transition to digital programming by broadcasters in the
first half of 2009. Net subscriber additions increased from 2008 primarily due to the increase in gross
additions, partially offset by higher subscriber disconnections due to a higher average monthly churn
rate on a larger subscriber base. Average monthly subscriber churn increased primarily due to stricter
upgrade and retention policies for existing customers as well as more aggressive competitor promotions
combined with a weaker economy.
55