DIRECTV 2009 Annual Report Download - page 120
Download and view the complete annual report
Please find page 120 of the 2009 DIRECTV annual report below. You can navigate through the pages in the report by either clicking on the pages listed below, or by using the keyword search tool below to find specific information within the annual report.-
 1
1 -
2
-
3
-
4
-
5
-
6
-
7
-
8
-
9
-
10
-
11
-
12
-
13
-
14
-
15
-
16
-
17
-
18
-
19
-
20
-
21
-
22
-
23
-
24
-
25
-
26
-
27
-
28
-
29
-
30
-
31
-
32
-
33
-
34
-
35
-
36
-
37
-
38
-
39
-
40
-
41
-
42
-
43
-
44
-
45
-
46
-
47
-
48
-
49
-
50
-
51
-
52
-
53
-
54
-
55
-
56
-
57
-
58
-
59
-
60
-
61
-
62
-
63
-
64
-
65
-
66
-
67
-
68
-
69
-
70
-
71
-
72
-
73
-
74
-
75
-
76
-
77
-
78
-
79
-
80
-
81
-
82
-
83
-
84
-
85
-
86
-
87
-
88
-
89
-
90
-
91
-
92
-
93
-
94
-
95
-
96
-
97
-
98
-
99
-
100
-
101
-
102
-
103
-
104
-
105
-
106
-
107
-
108
-
109
-
 110
110 -
 111
111 -
 112
112 -
 113
113 -
 114
114 -
 115
115 -
 116
116 -
 117
117 -
 118
118 -
 119
119 -
 120
120 -
 121
121 -
 122
122 -
 123
123 -
 124
124 -
 125
125 -
 126
126 -
 127
127 -
 128
128 -
 129
129 -
 130
130 -
131
-
132
-
133
-
134
-
135
-
136
-
137
-
138
-
139
-
140
-
141
-
142
-
143
-
144
-
145
-
146
-
147
-
148
-
149
-
150
-
151
-
152
-
153
-
154
-
155
-
156
-
157
-
158
-
159
-
160
 |
 |

DIRECTV
NOTES TO THE CONSOLIDATED FINANCIAL STATEMENTS—(continued)
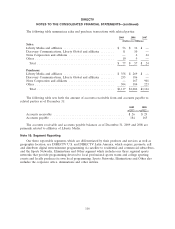
The following table sets forth information regarding shares repurchased and retired for the years
ended December 31:
2009 2008 2007
(Amounts in Millions,
Except Per Share Amounts)
Total cost of repurchased and retired shares ........................ $1,696 $3,174 $2,025
Average price per share ....................................... 23.79 24.12 23.48
Number of shares repurchased and retired ......................... 71 131 86
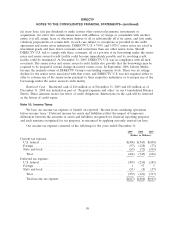
For the year ended December 31, 2009, we recorded the $1,696 million in repurchases as a
decrease of $591 million to ‘‘Common stock and additional paid in capital’’ and an increase of
$1,105 million to ‘‘Accumulated deficit’’ in the Consolidated Balance Sheets. For the year ended
December 31, 2008, we recorded the $3,174 million in repurchases as a decrease of $1,089 million to
‘‘Common stock and additional paid in capital’’ and an increase of $2,085 million to ‘‘Accumulated
deficit’’ in the Consolidated Balance Sheets. For the year ended December 31, 2007, we recorded the
$2,025 million in repurchases as a decrease of $692 million to ‘‘Common stock and additional paid in
capital’’ and an increase of $1,333 million to ‘‘Accumulated deficit’’ in the Consolidated Balance Sheets.
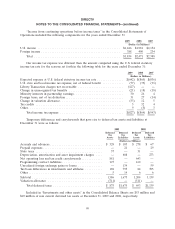
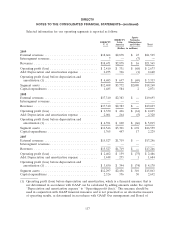
Other Comprehensive Income
The following represents the components of OCI, net of taxes, for the years ended December 31:
2009 2008 2007
Tax Tax
Pre-tax (Benefit) Net Pre-tax Tax Net Pre-tax (Benefit) Net
Amount Expense Amount Amount Benefit Amount Amount Expense Amount
(Dollars in Millions)
Amortization of amounts resulting
from changes in defined benefit
plan experience and actuarial
assumptions, net of taxes ..... $ (3) $ (1) $ (2) $(140) $(53) $(87) $26 $10 $16
Cumulative effect of change in
functional currency at Sky
Brazil ................... (181) (69) (112) — — — — — —
Foreign currency translation
activity during the period ..... 290 111 179 — — — (2) (1) (1)
Unrealized holding gains (losses)
on securities .............. 11 4 7 (32) (12) (20) 19 7 12
108