DIRECTV 2009 Annual Report Download - page 129
Download and view the complete annual report
Please find page 129 of the 2009 DIRECTV annual report below. You can navigate through the pages in the report by either clicking on the pages listed below, or by using the keyword search tool below to find specific information within the annual report.-
 1
1 -
2
-
3
-
4
-
5
-
6
-
7
-
8
-
9
-
10
-
11
-
12
-
13
-
14
-
15
-
16
-
17
-
18
-
19
-
20
-
21
-
22
-
23
-
24
-
25
-
26
-
27
-
28
-
29
-
30
-
31
-
32
-
33
-
34
-
35
-
36
-
37
-
38
-
39
-
40
-
41
-
42
-
43
-
44
-
45
-
46
-
47
-
48
-
49
-
50
-
51
-
52
-
53
-
54
-
55
-
56
-
57
-
58
-
59
-
60
-
61
-
62
-
63
-
64
-
65
-
66
-
67
-
68
-
69
-
70
-
71
-
72
-
73
-
74
-
75
-
76
-
77
-
78
-
79
-
80
-
81
-
82
-
83
-
84
-
85
-
86
-
87
-
88
-
89
-
90
-
91
-
92
-
93
-
94
-
95
-
96
-
97
-
98
-
99
-
100
-
101
-
102
-
103
-
104
-
105
-
106
-
107
-
108
-
109
-
110
-
111
-
112
-
113
-
114
-
115
-
116
-
117
-
118
-
 119
119 -
 120
120 -
 121
121 -
 122
122 -
 123
123 -
 124
124 -
 125
125 -
 126
126 -
 127
127 -
 128
128 -
 129
129 -
 130
130 -
 131
131 -
 132
132 -
 133
133 -
 134
134 -
 135
135 -
 136
136 -
 137
137 -
 138
138 -
 139
139 -
140
-
141
-
142
-
143
-
144
-
145
-
146
-
147
-
148
-
149
-
150
-
151
-
152
-
153
-
154
-
155
-
156
-
157
-
158
-
159
-
160
 |
 |

DIRECTV
NOTES TO THE CONSOLIDATED FINANCIAL STATEMENTS—(continued)
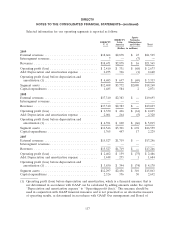
Selected information for our operating segments is reported as follows:
Sports
DIRECTV Networks,
DIRECTV Latin Eliminations
U. S. America and Other Total
(Dollars in millions)
2009
External revenues .............................. $18,664 $2,878 $ 23 $21,565
Intersegment revenues ........................... 7 — (7) —
Revenues .................................... $18,671 $2,878 $ 16 $21,565
Operating profit (loss) ........................... $ 2,410 $ 331 $ (68) $ 2,673
Add: Depreciation and amortization expense .......... 2,275 366 (1) 2,640
Operating profit (loss) before depreciation and
amortization (1) .............................. $ 4,685 $ 697 $ (69) $ 5,313
Segment assets ................................ $12,408 $3,772 $2,080 $18,260
Capital expenditures ............................ 1,485 584 2 2,071
2008
External revenues .............................. $17,310 $2,383 $ — $19,693
Intersegment revenues ........................... — — — —
Revenues .................................... $17,310 $2,383 $ — $19,693
Operating profit (loss) ........................... $ 2,330 $ 426 $ (61) $ 2,695
Add: Depreciation and amortization expense .......... 2,061 264 (5) 2,320
Operating profit (loss) before depreciation and
amortization (1) .............................. $ 4,391 $ 690 $ (66) $ 5,015
Segment assets ................................ $12,546 $3,301 $ 692 $16,539
Capital expenditures ............................ 1,765 447 17 2,229
2007
External revenues .............................. $15,527 $1,719 $ — $17,246
Intersegment revenues ........................... — — — —
Revenues .................................... $15,527 $1,719 $ — $17,246
Operating profit (loss) ........................... $ 2,402 $ 159 $ (75) $ 2,486
Add: Depreciation and amortization expense .......... 1,448 235 1 1,684
Operating profit (loss) before depreciation and
amortization (1) .............................. $ 3,850 $ 394 $ (74) $ 4,170
Segment assets ................................ $12,297 $2,456 $ 310 $15,063
Capital expenditures ............................ 2,326 336 30 2,692
(1) Operating profit (loss) before depreciation and amortization, which is a financial measure that is
not determined in accordance with GAAP can be calculated by adding amounts under the caption
‘‘Depreciation and amortization expense’’ to ‘‘Operating profit (loss).’’ This measure should be
used in conjunction with GAAP financial measures and is not presented as an alternative measure
of operating results, as determined in accordance with GAAP. Our management and Board of
117